1 Introduction
In recent years, big data is applied to almost all aspects of people's life and work. Data, like land, labor and capital, has become important production factors of the country. Especially with the emergence of IoT technology, many devices in our life can transmit data through the Internet. People expect to use machine learning methods to transform these data into useful information and knowledge, which they use to a variety of fields, e.g., business management, manufacturing control, market analysis, engineering design, and scientific investigation, etc. It has become a trend to accelerate data transactions through a market-oriented approach
[1]. Microsoft Windows Azure data market, Infochimps, and Factual are examples of typical data markets
[2]. Therefore, an IoT data market model and optimal pricing scheme are needed to achieve the optimal utilization of IoT data resources.
Data providers and consumers can engage each other by bringing data to the data market as a commodity, sharing and enhancing the data utility
[3]. To establish an effective data trading market and ensure the interests of all participants, several problems need to be solved, such as determining the appropriate price for the raw data or services. Big data market models and pricing mechanisms have been proposed in a number of studies. The three stakeholders in a typical data market model are the service user, the service provider, and the data provider
[4, 5]. Users of the service either purchase data analysis services from service providers or buy the data provided by the data suppliers for use in making decisions. Related researchers have studied different pricing models, e.g., based on data size, data quality, information entropy, or based on auction, game. Furthermore, most studies focus on the value of data and customers' willingness-to-buy (WTB), but they rarely consider data providers' willingness-to-sell (WTS). When the recompense does not meet their expectations as a data provider, they have the right to refuse to sell their own data. Consequently, the WTS of data providers are considered in our work, with the aim of balancing the interests of various market participants, and then develop a model for the IoT data market that maximizes profits. In summary, the following are the primary contributions of this paper:
From the perspective of economics, the transaction behavior of each participant in the IoT data market is analysed. And an interesting functional formula is constructed to describe the WTS of the data provider to solve the problems ignored in the previous work.
Based on the diminishing marginal utility rule, a joint utility function model of data size and data quality is constructed, which lays a foundation for the establishment of pricing model.
We build a profit maximization model for the IoT data market that considers both the WTB of data consumers and the WTS of data providers. According to the numerical experimental data, the model is effective and the optimal solution to the profit function is obtained.
Other sections of the paper are arranged as follows: The associated work is reviewed in Section 2. Next, Section 3 describes the system model in detail. Section 4 discusses the problem of profit maximization and makes a theoretical analysis. The corresponding numerical experiments are carried out in Section 5. The final summary is provided in Section 6.
2 Related Works
How to set an acceptable price for data has become a matter of widespread concern with the rise of the IoT data market. Despite some challenges, there are still studies focusing on pricing problem. Existing pricing approaches are divided into two groups: data attribute-based pricing and market-based pricing.
From a data attribute perspective, for example, data size, data quality, privacy level, etc., relevant scholars have done some research. Niyato, et al.
[6] proposed a candidate utility function model related to data volume and then developed the pricing strategy of IoT. Alsheikh, et al.
[7] also discussed the optimal pricing problem of the IoT. Whether in independent service sales or service bundle sales, service providers will optimize the data size and service subscription fees to maximize their profits. It is unreasonable to only focus on data size to measure data utility. Some researchers began to be interested in the data quality from multiple dimensions, and then gave the pricing model. Data quality and the version control method were both taken into account in the two-level mathematical programming model for data pricing suggested by Yu, et al.
[8]. In order to determine the most effective versioning strategy for information products, Li, et al.
[9] reconsidered two key assumptions, namely the data product's quality and the consumers' self-selection behavior. The above studies are mainly focused on service providers and revolve around the issue of maximizing profits in the data market. The service provider evaluates data quality based on a certain strategy and pricing based on data quality. In order to facilitate transactions, the data market will consider the utility of data consumers and the willingness to buy. But they almost never thinks from the perspective of a data provider. Nowadays, many applications regularly collect and analyze the detailed personal data from large databases through data mining. The application users can sometimes benefit from sharing these data. Shen, et al.
[10] and Yang, et al.
[11] discussed the data pricing problem based on different privacy levels, and gave the corresponding pricing model. At this point, the security and privacy of personal big data have received attention, with the expectation of achieving a balance between data privacy protection and sharing. Nevertheless, the compensation mechanism is still provided by the data platform, which holds the initiative.
From a market perspective, auction pricing is one of the common pricing methods. To optimize the benefits of all stakeholders, Borjigin, et al.
[12] developed a double-auction method which was used to both service function chain routing and NFV pricing adjustment. Zhao, et al.
[13] proposed an efficient auction mechanism for high timeliness data pricing under mobile and wireless networks. Game theory is a mathematical analysis method for studying group behavior, which plays a role in many fields such as decision analysis, economics, sociology, political science, and computer science. In [
14], game theory was introduced to solve the problems in edge computing. The aim of the game is to minimize the end-to-end network's energy consumption and increase its resource utilization efficiency. In [
15], the researchers established an effective and responsible carbon emissions trading system based on a blockchain framework of game theory. In [
16], the paper studied the bank run in game theory. In recent years, game theory has gradually been applied to data market pricing. Stackelberg model is a price leadership model, which can be used to solve market pricing problems. In a cloud scenario, Valerio, et al.
[17] took into account the sale of resources by an IaaS provider to SaaS providers. The authors adopted the Stackelberg game model in the pricing strategy of the second stage. Xiao, et al.
[18] constructed an economic model of the IoT data market consisting of data providers, service providers and service users. In this study, the Stackelberg game method was also used. In [
19], a three-layer Stackelberg game among data owner, service provider and data buyer to obtain an optimal pricing strategy in the car sharing data market was formulated. Evolutionary game theory is also often used to solve the pricing problems faced in the data market. Zeng, et al.
[20] proposed a hybrid pricing mechanism for the transaction of the sensed data. They then used evolutionary game theory to analyze the dynamics of user behavior and the evolution of data markets. The main characteristic of game pricing is to consider the interactions among the three parties in the data market. Additionally, some academics have explored the data pricing model from other aspects. The most typical strategies among them are subscription, query-based pricing, bundling, and discrimination
[2]. For example, Miao, et al.
[21] explored the pricing problem for queries over incomplete data. And a sophisticated pricing mechanism was proposed, which takes a series of essential factors into consideration. However, these economic models still pay more attention to the interests of the data market and the WTB of the consumers, and the WTS of data providers has received subtle attention. Therefore, it is essential to develop such a big data market model and the efficient pricing strategy.
3 System Model
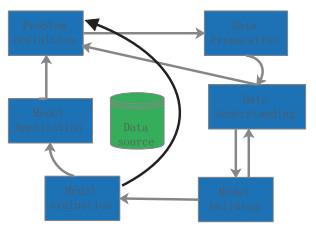
This paper discusses the pricing problem based on a typical market framework. This model is applicable in many data service-oriented scenarios, such as data marketplace Infochimps, crowdsourcing services platform Placemeter, IoT data trading platform Thingful, etc
[7]. The specific architecture is shown in
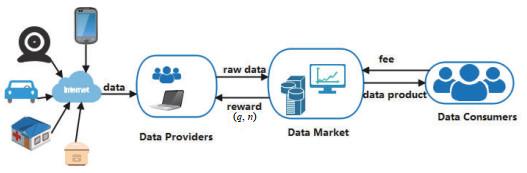
Figure 1, consists of three stakeholders: data consumers, data market and data providers.
Figure 1 An IoT data market trading framework |
Full size|PPT slide
Data providers: Data providers contribute the raw data generated by different devices, such as the smart phones, IoT gadgets and sensor nodes
[22]. Since data collection and storage need to consume resources, the data provider receives appropriate monetary compensation from data market.
Data market: The data market is a trusted platform by data providers and consumers where data services or datasets of different kinds are traded as assets. As a data platform, Factual cleans, organizes, and layers the collected data, and then provides it to developers, businesses, and organizations in need for use. The core concept of this platform is data neutrality, which means that data comes from everyone and should be accessible to everyone.
Data consumers: The consumers search datasets or services in the market according to their own needs and preferences. A data consumer makes purchase decisions according to service value and WTB.
For the convenience of understanding,
Table 1 lists the main parameters of the model.
| Notation | Definition |
| Remuneration for data providers |
| Price adjustment factor |
| Quality hierarchy of the data product |
| Data providers' WTS |
| Number of data consumers |
| Utility function of data |
| Subscription fee for the data product |
| Data size of data product |
3.1 Willingness-to-Sell of Data Providers
In an IoT data market, data providers' willingness to sell data is frequently tied to the following criteria in order to protect their own interests. First, the data provider usually sets the limit selling price
[23], i.e., the price offered by the buyer shall not be lower than the minimum selling price. Otherwise the data will not be sold. Second, the higher the reward for the same data resources, the higher the WTS is. Third, the more data items sold, the higher the seller's expected reward.
Based on the work of Benndorf, et al.
[24] and the above principles, we give the WTS function of data providers from the perspective of data size, which is defined as follows.
Definition 1 Willingness-To-Sell (WTS)) The willingness-to-sell of data providers depends on the reward received and the size of data provided. We consider the following fraction-based function:
where is the reward received by the data provider, and is the data size.
We scale
and
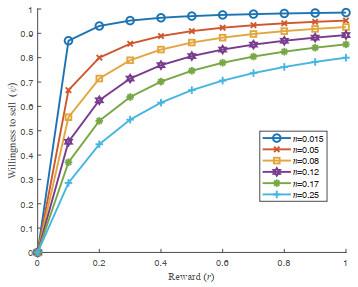
to the interval [0, 1]. The function trend of formula (1) is shown in
Figure 2. Suppose there are two datasets A and B, and the data size involved in dataset A is larger than that of dataset B. We note that when the data market bids the same for both datasets, the data provider of dataset B has a stronger WTS. In other words, it is easier to buy less data at a cheap price. Furthermore, data size is small (
), the value of WTS quickly tends to 1. The WTS to 1 increases more and more slowly as the size of data increases, which conforms to the rule of diminishing marginal benefits
[25].
Figure 2 WTS as a function of data reward based on the data size |
Full size|PPT slide
3.2 Quality Hierarchy
After collecting the data, the data market often needs to evaluate data quality and determine the compensation amount paid to the data provider. Data are evaluated from multiple quality dimensions, where each dimension refers to a specific aspect of data quality
[26]. Our evaluation framework covers four dimensions: Accuracy, Completeness, Redundancy and Consistency. These quality dimensions have practical significance. In the financial field, the accuracy of stock market data is crucial for investors. If real-time data on stock prices is inaccurate, it may lead investors to make incorrect investment decisions. In medical research, the completeness of patients' electronic health record (EHR) data is crucial for the study. If there is a lack of key information in EHR, such as the patient's medication history or allergic reactions, research results based on these incomplete data may mislead doctors' treatment decisions. In
Table 2, we introduce and define these four DQ dimensions
[27, 28].
| Attributes | Description | Formula |
| Accuracy | The proportion of the correct number of units in the data source. | |
| Completeness | The proportion of complete elements in the dataset. | |
| Consistency | Data in a certain domain is often constrained by rules. These rules can be clearly defined business rules or they can be established at run time as part of the data mining process. For example, the article identifier must satisfy a certain regular expression. The consistency of individual attribute values is assessed by the number and severity of inconsistencies indicated by attribute value rule violations. The consistency of the dataset is given by the consistency mean of the attribute values with consistency rules. | The consistency of an attribute value with m rules is defined as: , where is the relative importance of rule cri. And cri(ω) is the violation of consistency rulecri, If there are attribute values constrained by the consistency rule in the dataset, the consistency of the entire dataset is expressed as: Consistency =. |
| Redundancy | The proportion of duplicate records in the data source. | |
The calculation formula of data quality score is expressed as the weighted sum of each quality dimension, which is
where , , , are the weight factors. The values can be reasonably set by the users. The quality score is specified as a number between 0 and 1 and determines the data quality level in this paper.
3.3 Utility of Data and Willingness-to-Buy of Data Consumers
3.3.1 Utility of Data
Utility is one of the most commonly used concepts in economics, and the degree to which consumers satisfy their desires by owning or consuming goods or services is called the utility of goods or services. In this paper, goods or services refer to data products or services. In marketing, by collecting consumer's purchase history and preference data, consumer's behavior patterns can be analyzed, and more accurate marketing strategies can be formulated. This is the utility of data, which can help companies better understand the market and improve marketing effectiveness. In practice, data consumers primarily utilize data mining or machine learning technology to extract valuable information from acquired data, which is used for customer analysis, business decision-making, etc. The main process of data mining is shown in
Figure 3. Model construction and training are important links, and the quality of the model has an important impact on the decision-making results. Generally, the more training data used, the better the performance of the model. With the same data size, the model is more effective when the data quality is higher. From this perspective, the utility of the data can be evaluated by the quality of the model. Yang, et al.
[25] evaluated the data utility through a quality hierarchy. Niyato, et al.
[6] defined the data utility function from the dimension of data size. However, it is unreasonable to consider only one side. In this paper, we define a joint utility function based on the quality level
and data size
, which is formulated as:
Figure 3 The main process of data mining |
Full size|PPT slide
where , , , is the fitting parameter. We assume that utility function satisfies the law of diminishing marginal utility. In other words, the first-order partial derivative of to and is greater than 0, whereas the second-order partial derivative is less than 0.
Classification problem is the most long history in the field of data mining, and it is also a more thorough problem. This research uses principles learned from machine learning classification algorithms to assess the rationality of our utility function. The performance index of evaluating classification problem is classification accuracy. Therefore, data utility is regarded as the accuracy of the classification model.
Assuming that the training set contains
samples and the test set has
samples, we evaluate the model on the test set after building it on the training set. Each test sample can be expressed as
, where
is the attribute value and
is the actual category. After the test samples are input into the model, the classification model gives the prediction category
. A good classification model aims to minimize the error between
and
. In the testing stage, we will get the accuracy of the classification model, i.e., data utility. To determine the fitting parameters in formula (3), we conduct experiments from different perspectives using KNN algorithm based on MNIST dataset. In the experiments, the noise ratio of the data set is used to represent the quality of the data
[15]. We select
items at random from the total of
items in the training data set, and the original labels of the selected items are changed with a random digit between 0 and 9. Then the noise ratio refers to the proportion of noise data in the dataset:
Firstly, we suppose the quality score of the training set is the same, and adjust the data size of the training set for experiment. A series of test points are represented by , where is the value of accuracy, and . We fit the utility function by minimizing the square error sum:
Assuming that training set is noise free, i.e., the noise ratio is 0, and conduct experiments based on data sets of different sizes.
Figure 4(a) shows the relationship curve between classification accuracy and utility function. It can be observed that the accuracy of classification will increase as the data size does. In addition, the accuracy increases more and more slowly when the data size is large enough. Secondly, assuming that the data size in the training set is the same, the quality of the training set is changed for the experiment.
Figure 4(b) demonstrates the fitting relationship between classification accuracy and utility function at different quality levels. It can be shown that as the noise increases, the classification accuracy decreases. When
is set to 0.92 and
is set to 5.3, the utility function can well approximate the actual results.
Figure 4(c) shows the results of classification accuracy under different noise ratio and data size. The fitting image of the utility function under various data sizes and quality levels is shown in
Figure 4(d). They verifies the rationality of our proposed model.
Figure 4 Estimation of utility function: (a) estimation of utility function under data size; (b) estimation of utility function under noise ratio; (c) the actual accuracy under different data size and noise ratio; (d) utility function values under different data size and noise ratio. |
Full size|PPT slide
3.3.2 Willingness-to-Buy of Data Consumers
Compared with the WTS of data providers, data consumers have the willingness-to-buy (WTB) of different data. WTB indicates the highest price that consumers will pay for a data product
[29]. From an economic perspective, WTB depends on the utility of data. Let
represent the actual WTB of a consumer for a data product,
denote a nominal WTB. Because different consumers have different demands and preferences for data,
is randomly distributed between 0 and
(the maximum nominal WTB). To simplify the problem, we adopt the following function to express the actual WTB of a consumer:
4 The Optimal Pricing of Data Market
4.1 Profit Function
The profit of the IoT data market for the data product depends on difference between revenue and cost. On one hand, the cost of data market stems from obtaining raw data, and on the other hand from data storage, processing, and management. In this paper, we ignore other costs and only consider the cost of purchasing data from data providers. In most data transactions, pricing is often based only on the evaluation results of data quality by the data market. But in fact, each data provider has its own view on the value of the data sold. For example, the willingness of data providers to sell is affected by the data size and the remuneration they receive. Therefore, this paper defines the total purchasing cost of the data product from the two aspects of WTS and quality level , which is as follows:
where is the final cost paid by the data market to the data provider, and is the cost adjustment factor. The is a weight factor, which can be set by user.
Assuming that every consumer in the data market wants to buy data products with greater value and utility with less money, we consider that consumers' WTB meet the following economic principles: Ⅰ) Consumers have a psychological price ceiling for a data product, that is, they will not purchase the product beyond the price; Ⅱ) When the price of data products with the same quality rises, consumers' WTB decreases; Ⅲ) Data consumers prefer to buy high-quality data products. According to formula (6), we have for the maximum actual WTB. If there are consumers in the data market for the data product , the probability density function indicates WTB, where . Then the revenue of the data market for the data product is:
where is the subscription fee of the data. We assume that users' WTB follows a uniform distribution, and set is 1. The revenue of the data market is expressed as:
Therefore, the profit function of data market is:
4.2 Optimal Pricing
In this paper, we assume that the trading entities in the data market are completely rational, without considering the impact of the interaction behavior of each participant on data trading. Next, we discuss the optimal pricing problem from two aspects.
1) The parameters and are tuned, and the others are reset to their default settings. The profit optimization problem is described as:
The two constraints in formula (11) respectively represent that the quality level and subscription fee of data products are nonnegative. By differentiating with respect to and , we have:
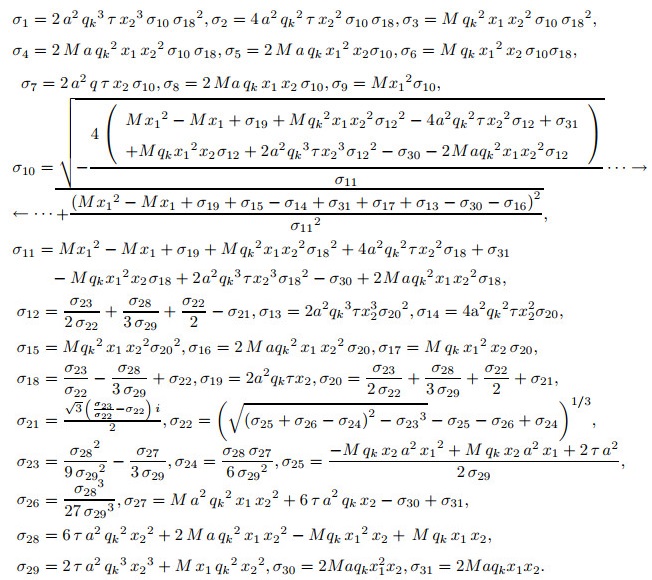
The closed solution of and can be obtained by simultaneous equations (12) and (13). The two roots for are:
where
And there are two roots for , namely,
where
The optimal quality level and subscription fee are obtained by the following formula:
Next, we find the second-order partial derivative of and :
Since the second-order partial derivatives are less than 0, it shows that if the value of is fixed, the solution in formula (11) is globally optimal. On the contrary, if remains unchanged, the solution in formula (11) is globally optimal.
2) The parameters and are explored, and the others are reset to their default settings. The problem of profit maximization can be expressed as follows:
Similarly, to find the first derivative of formula (10) with respect to and , we have:
There are closed form solutions for and . And the two roots of are:
where
(25)
And the two roots of are:
where
The optimal data size and subscription fee can be obtained by the following formula:
Similarly, the second-order partial derivative of and are all less than 0. It shows that if remains unchanged, the solution in formula (21) is globally optimal. Correspondingly, if remains unchanged, the solution in formula (21) is globally optimal.
5 Numerical Experiment
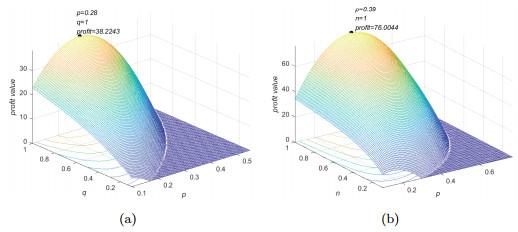
In this paper, we set specific parameters for experiments and give representative numerical results of the optimal pricing model. Firstly, the optimal solution of subscription fee and quality level is discussed. We set the parameters as follows: the number of consumers in the data market is 500, the quality level and subscription fee are taken from the interval [0.1, 1], and the parameter is set to 0.5, is 0.2 and is 0.08. The parameters of utility function use the experimental results in Section 3.3.1.
Figure 5(a) is a 3D surface diagram of
,
and profit, showing the trend of profit as
and
change with a fixed data size. Obviously, when taking the optimal value of data quality level and subscription fee, the data market can obtain the maximum profit. To be more intuitive, we also give the sections of
Figure 5(a).
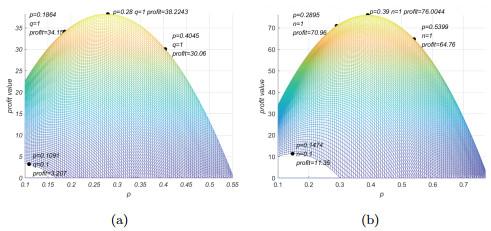
Figure 6(a) shows that for data with the same quality, as the subscription fee
increases gradually, the profit of the data market increases first and then decreases. So the data market's profit reaches the maximum at a certain subscription fee. In addition, when the data quality is poor, we can see that the market profit decreases quickly with the increase of subscription fee. Since data with poor quality levels is less valuable to customers, they are unwilling to purchase even if the subscription fee is low. The abscissa in
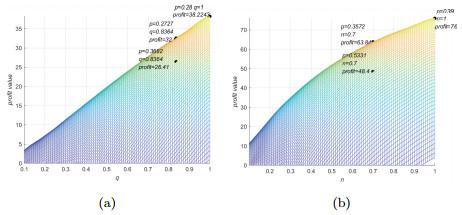
Figure 7(a) represents the quality level. When the data quality is better, the maximum profit of the data market also increases, indicating that data products with good quality are more popular.
Figure 5 3D surface diagram |
Full size|PPT slide
Figure 6 The profile about p |
Full size|PPT slide
Figure 7 The profile about q, n |
Full size|PPT slide
Next, we discuss the optimal solution of subscription fee
and data size
. The quality level is taken as a fixed value of 0.6, the data size
are taken from the interval [0.1, 1], and other parameter are set to default values. The 3D surface diagram of profit function and the corresponding sections are shown in
Figure 5(b),
Figure 6(b) and
Figure 7(b) respectively.
Figure 5(b) shows that the optimal solutions of
and
which maximize the profit of the data market are obtained. When
is the same, the subscription fee
is increased, the profit steadily increases, as shown in
Figure 6(b). The profit shows a negative tendency after achieving its maximum value, because consumers' WTB will decrease. Similarly, when data size is small, the WTB of the customers is low. According to
Figure 7(b), as the size of data increases, the maximum profit in the market also increases, because consumers consider that datasets with larger sizes of data as more valuable.
6 Conclusion
In this paper, we propose a joint utility function based on data size and data quality, and construct a profit maximization model of the data market, in which the WTS of data providers is considered. Firstly, we define the WTS function of the data provider and give a method to evaluate the data quality. Secondly, a joint utility function based on quality level and data size is proposed, and its parameters are fitted by machine learning algorithm. Furthermore, we define the WTB of data consumers based on the proposed utility function. Finally, we propose the data market pricing model and prove the existence of its optimal solution.
{{custom_sec.title}}
{{custom_sec.title}}
{{custom_sec.content}}
 PDF(1601 KB)

 ), Jian YANG2,*(
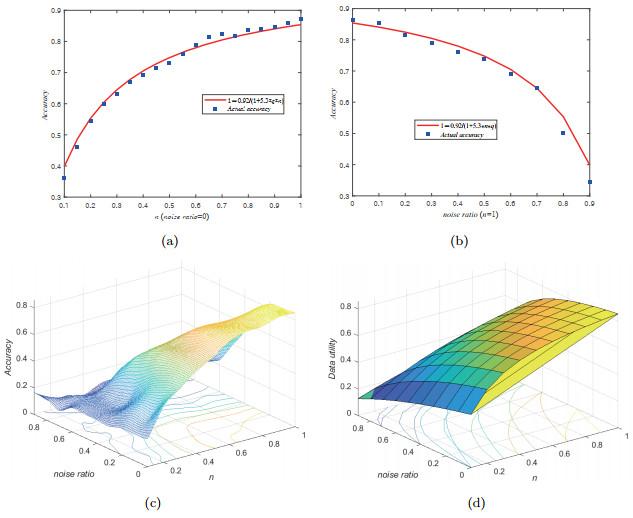
 Figure 1 An IoT data market trading framework
 Table 1 Major symbols


