 PDF(643 KB)

Return and Volatility Spillovers Effects: Study of Asian Emerging Stock Markets
Bhowmik RONI, Ghulam ABBAS, Shouyang WANG
Journal of Systems Science and Information ›› 2018, Vol. 6 ›› Issue (2) : 97-119.
PDF(643 KB)
PDF(643 KB)
Return and Volatility Spillovers Effects: Study of Asian Emerging Stock Markets
This paper examines the extent of contagion and interdependence across the six Asian emerging countries stock markets (e.g., Bangladesh, China, India, Malaysia, the Philippine, and South Korea) and then try to quantify the extent of the Asian emerging market fluctuations which are described by intra-regional contagion effect. These markets experienced both fast growth and key upheaval during the sample period, and thus, provide potentially rich information on the nature of border market interactions. Using the daily stock market index data from January 2002 to December 2016 (breaking the 15 years data set into three sub periods; pre-crisis, crisis, and post crisis periods); particularly make attention to the global financial crisis of 2007~2008. The return and volatility spillovers are modeled through the GARCH (generalized autoregressive conditional heteroscedasticity), pairwise Granger causality tests, and the forecast error variance decomposition in a generalized VAR (vector auto regression) models. This paper shows that volatility and return spillovers behave very differently over time, during the pre-crisis, crisis, and post crisis periods. Importantly, Asian emerging stock markets interaction is less before the global financial crisis period. The return and volatility spillover indices touch their respective historical peaks during the global financial crisis 2007~2008, however Bangladeshi market faces this condition in 2009~2010.
spillover / stock returns / volatility / global financial crisis / GARCH / Granger causality / variance decomposition {{custom_keyword}} /
Table 1 Sample countries and their indices Sources: Each countries stock exchange website |
| Country | Region | Stock Exchange | Location | Founded | Index Selected | Abbreviation Used | Listed Companies |
| Bangladesh | South Asia | Dhaka Stock Exchange | Dhaka | 1954 | DSEX | DSEX | 562 |
| China | East Asia | Shanghai Stock Exchange | Shanghai | 1990 | SSE Composite | SSE Composite | 1, 240 |
| India | South Asia | Bombay Stock Exchange | Mumbai | 1875 | S & P BSE SENSEX | BSE30 | 6, 354 |
| Malaysia | Southeast Asia | Bursa Malaysia Berhad | Kuala Lumpur | 1964 | FBM KLCI | FBMKLCI | 900 |
| Philippine | Southeast Asia | The Philippine Stock Exchange | Metro Manila | 1927 | PSE Composite | PSEi | 344 |
| South Korea | East Asia | Korea Exchange | Busan | 1956 | Korea Composite | KOSPI | 2, 030 |
Table 2 Descriptive statistics Sources: Author's calculations |
| Countries | BD | CN | IN | MY | PH | KR |
| Mean | 0.0006 | 0.0003 | 0.0006 | 0.0003 | 0.0005 | 0.0004 |
| Median | 0.0004 | 0.0007 | 0.0008 | 0.0003 | 0.0004 | 0.0005 |
| Max. | 0.226 | 0.095 | 0.173 | 0.044 | 0.098 | 0.161 |
| Min. | -0.099 | -0.088 | -0.111 | -0.095 | -0.123 | -0.106 |
| Std.Dev. | 0.014 | 0.016 | 0.014 | 0.007 | 0.012 | 0.014 |
| Skewness | 1.27 | -0.24 | 0.14 | -0.73 | -0.44 | 0.03 |
| Kurtosis | 22.75 | 7.45 | 13.79 | 13.90 | 10.12 | 13.48 |
| JarqueBera | 13595 | 9263 | 8971 | 9671 | 8368 | 7868 |
| Prob. Of JB | 0.0000 | 0.0000 | 0.0000 | 0.0000 | 0.0000 | 0.0000 |
| Observations | 3905 | 3905 | 3905 | 3905 | 3905 | 3905 |
| Note: The symbols BD, CN, IN, MY, PH, and KR denote the countries, Bangladesh, China, India, Malaysia, Philippine, and South Korea, are respectively. |
Table 3 Unit root test Sources: Author's calculations. Sample 2002~2016 |
| Countries | Period | Levels | First Differences | |||||
| ADF | PP | KPSS | ADF | PP | KPSS | |||
| Bangladesh | Full | -1.18 | -1.24 | 5.63*** | -27.64*** | -59.98*** | 0.09 | |
| Pre-Crisis | -0.79 | -0.78 | 3.28*** | -32.93*** | -32.93*** | 0.18 | ||
| Crisis | -1.27 | -1.26 | 3.41*** | -27.25*** | -34.44*** | 0.17 | ||
| Post-Crisis | -3.46*** | -3.67*** | 0.66** | -14.19*** | -35.70*** | 0.13 | ||
| China | Full | -1.78 | -1.76 | 2.05*** | -28.17*** | -60.63*** | 0.07 | |
| Pre-Crisis | 2.94 | 2.78 | 0.64** | -34.37*** | -34.52*** | 1.03**** | ||
| Crisis | -1.15 | -1.21 | 1.39*** | -35.97*** | -35.99*** | 0.22 | ||
| Post-Crisis | -1.56 | -1.37 | 2.27*** | -15.97*** | -32.76*** | 0.08 | ||
| India | Full | -0.97 | -0.92 | 6.99*** | -58.05*** | -57.94*** | 0.04 | |
| Pre-Crisis | 1.67 | 1.56 | 3.85*** | -26.37*** | -33.15*** | 0.47** | ||
| Crisis | -1.77 | -1.71 | 1.18*** | -33.17*** | -33.11*** | 0.10 | ||
| Post-Crisis | -1.71 | -1.72 | 3.65*** | -34.08*** | -34.04*** | 0.15 | ||
| Malaysia | Full | -1.26 | -1.23 | 7.05*** | 56.17*** | -56.28*** | 0.13 | |
| Pre-Crisis | 0.18 | 0.07 | 3.77*** | -32.88*** | -33.09*** | 0.14 | ||
| Crisis | -0.96 | -0.99 | 1.52*** | -32.27*** | -32.26*** | 0.16 | ||
| Post-Crisis | -2.39 | -2.22 | 1.03*** | -32.44*** | -32.29*** | 0.22 | ||
| Philippine | Full | -0.51 | -0.53 | 7.14*** | -34.20*** | -57.87*** | 0.08 | |
| Pre-Crisis | 1.12 | 1.26 | 4.04*** | -32.02*** | -32.02*** | 0.34* | ||
| Crisis | -0.74 | -0.65 | 1.81*** | -31.89*** | -31.73*** | 0.21 | ||
| Post-Crisis | -2.51 | -2.49 | 3.19*** | -20.84*** | -34.32*** | 0.25 | ||
| South Korea | Full | -1.56 | -1.53 | 6.52*** | -61.27*** | -61.33*** | 0.06 | |
| Pre-Crisis | -0.05 | 0.03 | 3.56*** | -35.57*** | -35.61*** | 0.19 | ||
| Crisis | -1.81 | -1.78 | 1.27*** | -35.18*** | -35.19*** | 0.08 | ||
| Post-Crisis | -4.52*** | -4.53*** | 0.85*** | -35.85*** | -36.01*** | 0.03 | ||
| *Denote statistical significance at the 10% level. **Denote statistical significance at the 5% level. ***Denote statistical significance at the 1% level. |
Table 4 Correlations in the variances of the stock returns (%) Source: Author's calculations |
| Countries | BD | CN | IN | MY | PH | KR |
| A. Full Periods (2002~2016) | ||||||
| BD | 100 | |||||
| CN | -0.20 | 100 | ||||
| IN | -0.79 | 6.09* | 100 | |||
| MY | -0.38 | 10.56* | 9.06* | 100 | ||
| PH | -0.22 | 9.75* | 20.18* | 16.12* | 100 | |
| KR | -0.96 | 7.48* | 14.20* | 16.50* | 16.71* | 100 |
| B. Pre Crisis Periods (2002~2006) | ||||||
| BD | 100 | |||||
| CN | 4.89 | 100 | ||||
| IN | -3.04 | 0.98 | 100 | |||
| MY | 3.65 | 10.38* | 2.02 | 100 | ||
| PH | 0.96 | 5.44* | 4.49 | 2.19 | 100 | |
| KR | -0.16 | -0.48 | 10.13* | 13.29* | 7.25* | 100 |
| C. Crisis Periods (2007~2011) | ||||||
| BD | 100 | |||||
| CN | -1.42 | 100 | ||||
| IN | -0.95 | 5.80* | 100 | |||
| MY | -0.47 | 16.46* | 11.80* | 100 | ||
| PH | -0.34 | 8.57* | 10.97* | 24.42* | 100 | |
| KR | -1.24 | 14.01* | 11.24* | 23.26* | 23.85* | 100 |
| D. Post Crisis Periods (2012~2016) | ||||||
| BD | 100 | |||||
| CN | 1.66 | 100 | ||||
| IN | 0.01 | 10.81* | 100 | |||
| MY | -1.79 | 2.00 | 13.81* | 100 | ||
| PH | -1.79 | 15.37* | 27.19* | 19.04* | 100 | |
| KR | -4.23 | 9.53* | 25.74* | 11.84* | 15.72* | 100 |
| Note: The symbols BD, CN, IN, MY, PH, and KR denote the countries, Bangladesh, China, India, Malaysia, Philippine, and South Korea, respectively. *Denote statistical significance at the 5% level. |
Table 5 Pairwise Granger causality summary Source Author's calculations |
| Null Hypothesis | F-Statistic and Causality Direction (CD) | |||||
| Pre-crisis F-St. | CD | Crisis F-St. | CD | Post-crisis F-St. | CD | |
| CN does not Granger Cause BD | 1.0302 | CN ≠ BD | 0.0026 | CN ≠ BD | 1.0911 | CN ≠ BD |
| BD does not Granger Cause CN | 1.6775 | 0.9475 | 0.3986 | |||
| IN does not Granger Cause BD | 5.5029** | IN → BD | 0.8323 | IN ≠ BD | 3.1388* | IN → BD |
| BD does not Granger Cause IN | 0.1607 | 0.8171 | 0.9550 | |||
| MY does not Granger Cause BD | 0.1827 | MY ≠ BD | 1.1031 | MY≠ BD | 1.4804 | MY ≠ BD |
| BD does not Granger Cause MY | 0.6748 | 0.0289 | 0.5079 | |||
| PH does not Granger Cause BD | 0.8128 | PH ≠ BD | 1.0690 | PH ≠ BD | 2.8917 | PH ≠ BD |
| BD does not Granger Cause PH | 1.9346 | 1.7302 | 0.1232 | |||
| KR does not Granger Cause BD | 2.6934 | KR ≠ BD | 0.0135 | KR ≠ BD | 3.8231 | KR ≠ BD |
| BD does not Granger Cause KR | 0.5174 | 0.7928 | 0.7934 | |||
| IN does not Granger Cause CN | 1.0351 | IN ≠ CN | 6.8276** | IN ↔ CN | 2.9565 | CN →IN |
| CN does not Granger Cause IN | 0.7161 | 5.8516** | 3.4556* | |||
| MY does not Granger Cause CN | 1.2658 | CN → MY | 0.8427 | MY≠ CN | 0.5741 | CN →MY |
| CN does not Granger Cause MY | 3.3059* | 1.4002 | 1.3905** | |||
| PH does not Granger Cause CN | 2.3654 | CN →PH | 0.2773 | CN →PH | 0.3678* | PH ↔ CN |
| CN does not Granger Cause PH | 3.6715* | 4.6604** | 2.4580** | |||
| KR does not Granger Cause CN | 0.2572 | KR ≠ CN | 0.0951 | KR ≠ CN | 2.7225 | CN →KR |
| CN does not Granger Cause KR | 0.2293 | 2.2175 | 0.1235** | |||
| MY does not Granger Cause IN | 1.5617 | IN →MY | 2.2327* | IN ↔ MY | 0.5929 | IN →MY |
| IN does not Granger Cause MY | 3.1962* | 7.6370** | 5.7640** | |||
| PH does not Granger Cause IN | 0.5093 | IN →PH | 0.8078 | IN →PH | 1.9012* | IN ↔ PH |
| IN does not Granger Cause PH | 4.8743** | 9.3405** | 8.4977** | |||
| KR does not Granger Cause IN | 0.9511 | IN →KR | 2.3358 | IN →KR | 7.7406** | IN ↔ KR |
| IN does not Granger Cause KR | 7.1807** | 12.6654** | 13.6812** | |||
| PH does not Granger Cause MY | 1.1604 | MY →PH | 4.4777* | MY↔ PH | 0.6637 | MY ≠ PH |
| MY does not Granger Cause PH | 3.5309* | 11.8463** | 2.8900 | |||
| KR does not Granger Cause MY | 0.3116 | KR ≠ MY | 8.0719** | KR↔ MY | 2.9202* | KR → MY |
| MY does not Granger Cause KR | 0.0133 | 1.8816 | 1.0386 | |||
| KR does not Granger Cause PH | 2.5079* | KR → PH | 13.2396** | KR ↔ PH | 4.1750* | KR → PH |
| PH does not Granger Cause KR | 1.4806 | 3.1420* | 1.1743 | |||
| Note: * and ** denote the significance level at 5% and 1%, respectively. The symbols BD, CN, IN, MY, PH, and KR denote the countries, Bangladesh, China, India, Malaysia, Philippine, and South Korea, respectively. Sample: 2002 |
Table 6(a) Asian emerging markets return spillovers Source: Author's calculations. Sample 2002~2016 |
| Lag | Bangladesh | China | India | Malaysia | Philippine | South Korea |
| A. Percentage of conditional volatility of Bangladesh stock returns explained by returns of | ||||||
| 1 | 100.00 | 0.00 | 0.00 | 0.00 | 0.00 | 0.00 |
| 5 | 99.70 | 0.08 | 0.11 | 0.08 | 0.03 | 0.00 |
| 10 | 98.71 | 0.08 | 1.10 | 0.07 | 0.04 | 0.00 |
| 20 | 98.49 | 0.28 | 1.12 | 0.07 | 0.04 | 0.00 |
| 40 | 97.00 | 0.72 | 2.17 | 0.07 | 0.03 | 0.01 |
| 60 | 96.74 | 1.04 | 2.12 | 0.06 | 0.02 | 0.02 |
| B. Percentage of conditional volatility of China stock returns explained by returns of | ||||||
| 1 | 0.00 | 100.00 | 0.00 | 0.00 | 0.00 | 0.00 |
| 5 | 0.00 | 98.39 | 0.53 | 1.00 | 0.05 | 0.02 |
| 10 | 0.00 | 98.09 | 0.54 | 1.30 | 0.05 | 0.02 |
| 20 | 0.00 | 97.20 | 1.03 | 1.69 | 0.05 | 0.03 |
| 40 | 0.00 | 97.00 | 1.13 | 1.79 | 0.04 | 0.04 |
| 60 | 0.00 | 96.15 | 1.31 | 2.41 | 0.04 | 0.09 |
| C. Percentage of conditional volatility of India stock returns explained by returns of | ||||||
| 1 | 0.05 | 3.64 | 96.31 | 0.00 | 0.00 | 0.00 |
| 5 | 0.13 | 3.66 | 95.21 | 0.52 | 0.13 | 0.35 |
| 10 | 0.12 | 3.67 | 95.05 | 0.63 | 0.18 | 0.35 |
| 20 | 0.10 | 3.70 | 94.70 | 0.72 | 0.43 | 0.35 |
| 40 | 0.08 | 3.80 | 94.31 | 0.83 | 0.53 | 0.45 |
| 60 | 0.11 | 3.84 | 94.65 | 0.52 | 0.33 | 0.55 |
| D. Percentage of conditional volatility of Malaysia stock returns explained by returns of | ||||||
| 1 | 0.05 | 4.43 | 9.19 | 86.33 | 0.00 | 0.00 |
| 5 | 0.07 | 4.44 | 11.68 | 83.60 | 0.13 | 0.07 |
| 10 | 0.07 | 4.44 | 11.68 | 83.60 | 0.13 | 0.07 |
| 20 | 0.07 | 4.44 | 11.68 | 83.60 | 0.13 | 0.07 |
| 40 | 0.07 | 4.44 | 11.68 | 83.60 | 0.13 | 0.07 |
| 60 | 0.07 | 4.44 | 11.68 | 83.60 | 0.13 | 0.07 |
| E. Percentage of conditional volatility of the Philippine stock returns explained by returns of | ||||||
| 1 | 0.02 | 2.32 | 4.99 | 9.45 | 83.22 | 0.00 |
| 5 | 0.05 | 2.68 | 9.87 | 9.42 | 77.75 | 0.22 |
| 10 | 0.05 | 2.68 | 9.87 | 9.42 | 77.75 | 0.22 |
| 20 | 0.05 | 2.68 | 9.87 | 9.42 | 77.75 | 0.22 |
| 40 | 0.05 | 2.68 | 9.87 | 9.42 | 77.75 | 0.22 |
| 60 | 0.05 | 2.68 | 9.87 | 9.42 | 77.75 | 0.22 |
| F. Percentage of conditional volatility of South Korea stock returns explained by returns of | ||||||
| 1 | 0.01 | 4.65 | 13.34 | 8.69 | 2.28 | 71.03 |
| 5 | 0.07 | 4.56 | 15.08 | 8.57 | 2.32 | 69.40 |
| 10 | 0.07 | 4.56 | 15.08 | 8.57 | 2.32 | 69.40 |
| 20 | 0.07 | 4.56 | 15.08 | 8.57 | 2.32 | 69.40 |
| 40 | 0.07 | 4.56 | 15.08 | 8.57 | 2.32 | 69.40 |
| 60 | 0.07 | 4.56 | 15.08 | 8.57 | 2.32 | 69.40 |
Table 6(b) Asian emerging markets volatility spillovers Source: Author's calculations. Sample 2002~2016 |
| Lag | Bangladesh | China | India | Malaysia | Philippine | South Korea |
| A. Percentage of conditional volatility of Bangladesh stock returns explained by conditional volatilities of returns of | ||||||
| 1 | 100.00 | 0.00 | 0.00 | 0.00 | 0.00 | 0.00 |
| 5 | 99.97 | 0.01 | 0.01 | 0.00 | 0.02 | 0.00 |
| 10 | 99.39 | 0.03 | 0.53 | 0.03 | 0.01 | 0.00 |
| 20 | 98.74 | 0.12 | 1.06 | 0.06 | 0.02 | 0.00 |
| 40 | 98.09 | 0.24 | 1.57 | 0.07 | 0.02 | 0.00 |
| 60 | 98.01 | 0.30 | 1.60 | 0.08 | 0.01 | 0.00 |
| B. Percentage of conditional volatility of China stock returns explained by conditional volatilities of returns of | ||||||
| 1 | 0.00 | 100.00 | 0.00 | 0.00 | 0.00 | 0.00 |
| 5 | 0.02 | 99.49 | 0.37 | 0.09 | 0.04 | 0.00 |
| 10 | 0.02 | 98.05 | 0.55 | 1.32 | 0.05 | 0.01 |
| 20 | 0.02 | 96.19 | 0.79 | 2.90 | 0.07 | 0.03 |
| 40 | 0.02 | 95.00 | 1.08 | 3.72 | 0.14 | 0.04 |
| 60 | 0.02 | 93.40 | 2.22 | 4.13 | 0.19 | 0.04 |
| C. Percentage of conditional volatility of India stock returns explained by conditional volatilities of returns of | ||||||
| 1 | 0.00 | 0.09 | 99.91 | 0.00 | 0.00 | 0.00 |
| 5 | 0.00 | 0.44 | 98.09 | 0.35 | 0.81 | 0.30 |
| 10 | 0.00 | 0.79 | 95.39 | 1.68 | 1.49 | 0.66 |
| 20 | 0.01 | 1.57 | 89.36 | 4.60 | 2.91 | 1.55 |
| 40 | 0.01 | 3.13 | 81.47 | 7.30 | 4.96 | 3.13 |
| 60 | 0.01 | 4.29 | 78.07 | 7.90 | 5.84 | 3.90 |
| D. Percentage of conditional volatility of Malaysia stock returns explained by conditional volatilities of returns of | ||||||
| 1 | 0.00 | 1.37 | 0.68 | 97.96 | 0.00 | 0.00 |
| 5 | 0.00 | 1.73 | 1.32 | 96.56 | 0.30 | 0.08 |
| 10 | 0.02 | 2.44 | 1.64 | 94.46 | 0.95 | 0.50 |
| 20 | 0.03 | 3.89 | 2.23 | 89.65 | 2.46 | 1.73 |
| 40 | 0.04 | 6.14 | 3.22 | 82.81 | 4.34 | 3.46 |
| 60 | 0.04 | 7.47 | 3.76 | 79.71 | 4.98 | 4.04 |
| E. Percentage of conditional volatility of the Philippine stock returns explained by conditional volatilities of returns of | ||||||
| 1 | 0.00 | 1.71 | 0.09 | 4.36 | 93.84 | 0.00 |
| 5 | 0.00 | 3.92 | 4.44 | 8.05 | 81.71 | 1.88 |
| 10 | 0.01 | 4.49 | 5.44 | 8.46 | 79.18 | 2.42 |
| 20 | 0.01 | 5.23 | 6.48 | 8.74 | 76.39 | 3.15 |
| 40 | 0.02 | 6.18 | 7.38 | 8.94 | 73.56 | 3.91 |
| 60 | 0.02 | 6.75 | 7.68 | 9.01 | 72.36 | 4.18 |
| F. Percentage of conditional volatility of South Korea stock returns explained by conditional volatilities of returns of | ||||||
| 1 | 0.01 | 0.04 | 1.24 | 1.60 | 0.39 | 96.72 |
| 5 | 0.01 | 0.11 | 3.80 | 1.35 | 1.91 | 92.82 |
| 10 | 0.01 | 0.43 | 6.33 | 1.58 | 4.17 | 87.47 |
| 20 | 0.01 | 1.39 | 10.36 | 2.23 | 8.17 | 77.84 |
| 40 | 0.01 | 3.45 | 14.30 | 3.45 | 12.21 | 66.58 |
| 60 | 0.01 | 5.08 | 15.52 | 4.17 | 13.46 | 61.77 |
| 1 |
{{custom_citation.content}}
{{custom_citation.annotation}}
|
| 2 |
{{custom_citation.content}}
{{custom_citation.annotation}}
|
| 3 |
{{custom_citation.content}}
{{custom_citation.annotation}}
|
| 4 |
{{custom_citation.content}}
{{custom_citation.annotation}}
|
| 5 |
{{custom_citation.content}}
{{custom_citation.annotation}}
|
| 6 |
{{custom_citation.content}}
{{custom_citation.annotation}}
|
| 7 |
{{custom_citation.content}}
{{custom_citation.annotation}}
|
| 8 |
{{custom_citation.content}}
{{custom_citation.annotation}}
|
| 9 |
{{custom_citation.content}}
{{custom_citation.annotation}}
|
| 10 |
{{custom_citation.content}}
{{custom_citation.annotation}}
|
| 11 |
{{custom_citation.content}}
{{custom_citation.annotation}}
|
| 12 |
{{custom_citation.content}}
{{custom_citation.annotation}}
|
| 13 |
{{custom_citation.content}}
{{custom_citation.annotation}}
|
| 14 |
{{custom_citation.content}}
{{custom_citation.annotation}}
|
| 15 |
{{custom_citation.content}}
{{custom_citation.annotation}}
|
| 16 |
{{custom_citation.content}}
{{custom_citation.annotation}}
|
| 17 |
{{custom_citation.content}}
{{custom_citation.annotation}}
|
| 18 |
{{custom_citation.content}}
{{custom_citation.annotation}}
|
| 19 |
{{custom_citation.content}}
{{custom_citation.annotation}}
|
| 20 |
{{custom_citation.content}}
{{custom_citation.annotation}}
|
| 21 |
{{custom_citation.content}}
{{custom_citation.annotation}}
|
| 22 |
{{custom_citation.content}}
{{custom_citation.annotation}}
|
| 23 |
{{custom_citation.content}}
{{custom_citation.annotation}}
|
| 24 |
{{custom_citation.content}}
{{custom_citation.annotation}}
|
| 25 |
{{custom_citation.content}}
{{custom_citation.annotation}}
|
| 26 |
{{custom_citation.content}}
{{custom_citation.annotation}}
|
| 27 |
{{custom_citation.content}}
{{custom_citation.annotation}}
|
| 28 |
{{custom_citation.content}}
{{custom_citation.annotation}}
|
| 29 |
{{custom_citation.content}}
{{custom_citation.annotation}}
|
| 30 |
{{custom_citation.content}}
{{custom_citation.annotation}}
|
| 31 |
{{custom_citation.content}}
{{custom_citation.annotation}}
|
| 32 |
{{custom_citation.content}}
{{custom_citation.annotation}}
|
| 33 |
{{custom_citation.content}}
{{custom_citation.annotation}}
|
| 34 |
{{custom_citation.content}}
{{custom_citation.annotation}}
|
| 35 |
{{custom_citation.content}}
{{custom_citation.annotation}}
|
| 36 |
{{custom_citation.content}}
{{custom_citation.annotation}}
|
| 37 |
{{custom_citation.content}}
{{custom_citation.annotation}}
|
| 38 |
{{custom_citation.content}}
{{custom_citation.annotation}}
|
| 39 |
{{custom_citation.content}}
{{custom_citation.annotation}}
|
| 40 |
{{custom_citation.content}}
{{custom_citation.annotation}}
|
| 41 |
{{custom_citation.content}}
{{custom_citation.annotation}}
|
| 42 |
{{custom_citation.content}}
{{custom_citation.annotation}}
|
| 43 |
{{custom_citation.content}}
{{custom_citation.annotation}}
|
| 44 |
{{custom_citation.content}}
{{custom_citation.annotation}}
|
| 45 |
{{custom_citation.content}}
{{custom_citation.annotation}}
|
| 46 |
{{custom_citation.content}}
{{custom_citation.annotation}}
|
| 47 |
{{custom_citation.content}}
{{custom_citation.annotation}}
|
| 48 |
{{custom_citation.content}}
{{custom_citation.annotation}}
|
| 49 |
{{custom_citation.content}}
{{custom_citation.annotation}}
|
| 50 |
{{custom_citation.content}}
{{custom_citation.annotation}}
|
| 51 |
{{custom_citation.content}}
{{custom_citation.annotation}}
|
| 52 |
{{custom_citation.content}}
{{custom_citation.annotation}}
|
| 53 |
{{custom_citation.content}}
{{custom_citation.annotation}}
|
| 54 |
{{custom_citation.content}}
{{custom_citation.annotation}}
|
| 55 |
{{custom_citation.content}}
{{custom_citation.annotation}}
|
| 56 |
{{custom_citation.content}}
{{custom_citation.annotation}}
|
| 57 |
{{custom_citation.content}}
{{custom_citation.annotation}}
|
| 58 |
{{custom_citation.content}}
{{custom_citation.annotation}}
|
| 59 |
{{custom_citation.content}}
{{custom_citation.annotation}}
|
| 60 |
{{custom_citation.content}}
{{custom_citation.annotation}}
|
| 61 |
{{custom_citation.content}}
{{custom_citation.annotation}}
|
| 62 |
{{custom_citation.content}}
{{custom_citation.annotation}}
|
| 63 |
{{custom_citation.content}}
{{custom_citation.annotation}}
|
| 64 |
{{custom_citation.content}}
{{custom_citation.annotation}}
|
| 65 |
{{custom_citation.content}}
{{custom_citation.annotation}}
|
| 66 |
{{custom_citation.content}}
{{custom_citation.annotation}}
|
| {{custom_ref.label}} |
{{custom_citation.content}}
{{custom_citation.annotation}}
|
PDF(643 KB)
 Table 1 Sample countries and their indices Sources: Each countries stock exchange website
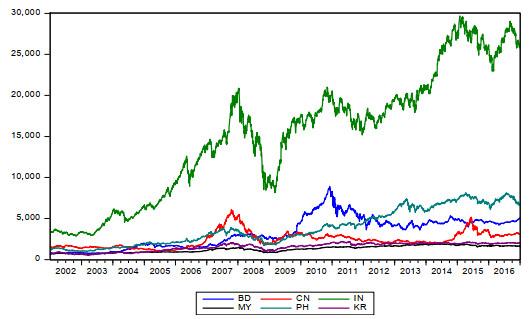
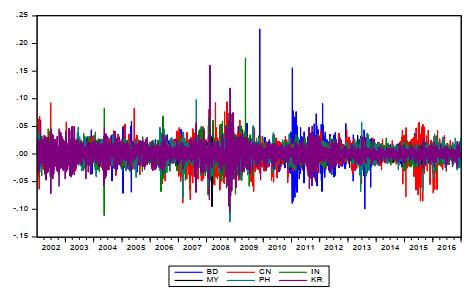
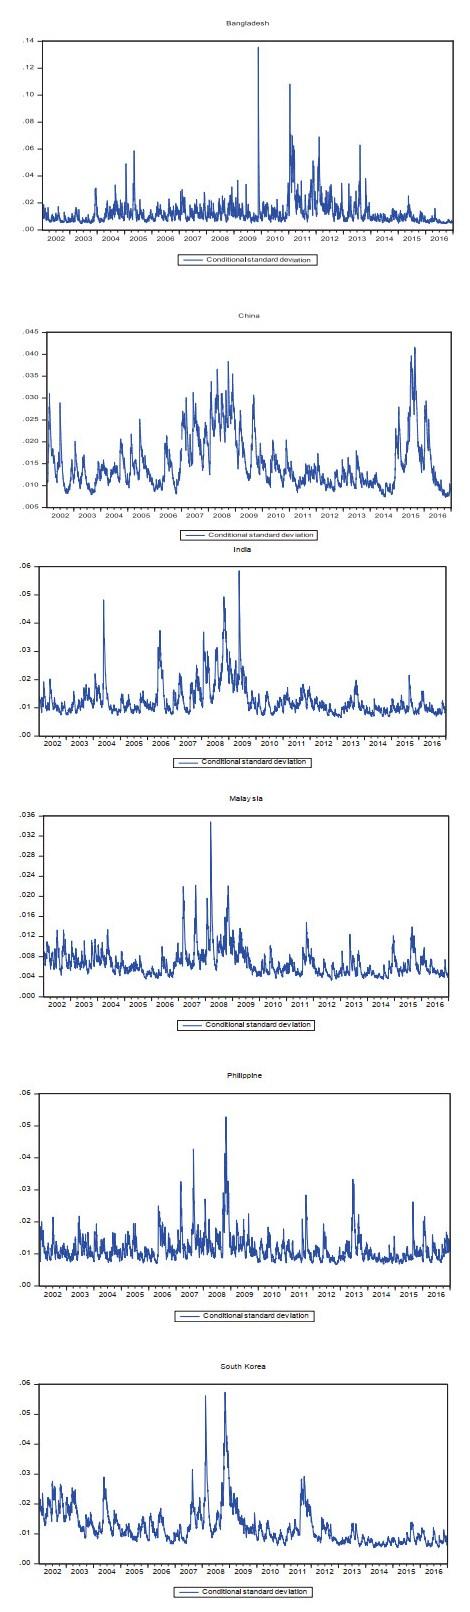
 Figure 1 The daily indices Sources: Author's calculationsFigure 2 The daily indices return volatility clustering Sources: Author's calculationsTable 2 Descriptive statistics Sources: Author's calculationsTable 3 Unit root test Sources: Author's calculations. Sample 2002~2016Table 4 Correlations in the variances of the stock returns (%) Source: Author's calculationsFigure 3 The conditional volatility Sources: Author's calculationsTable 5 Pairwise Granger causality summary Source Author's calculationsTable 6(a) Asian emerging markets return spillovers Source: Author's calculations. Sample 2002~2016Table 6(b) Asian emerging markets volatility spillovers Source: Author's calculations. Sample 2002~2016
/
| 〈 |
|
〉 |


