1 Introduction
Flooding is the one of the most frequent and destructive disasters on our earth, which affects millions of lives around the world every year. According to the statistics from international disaster database EMDAJ
[1], just from the 1970s to the early 21 century, flooding broke out 2156 times worldwide, coming along with the economic losses reaching 386 billion dollars and 206303 deaths in total. The affected population in flooding has risen from about 4 million a year in 1950 to more than one percent of the current global population. It is noteworthy that not simply did natural factors result in these shocking numbers, but also more importantly, the man-made did.
Over the past two centuries, the process of urbanization has led to a trend of creating urban agglomeration around the world, where at least 61% of the world's population will live in cities by 2030. This trend will significantly increase the number of people exposed to flooding and the accumulation of economic resources in these urban areas within the scope of floodplains. Due to the changing demographic and socio-economic conditions within these cities, unplanned urbanization, the development of high-risk areas with flood disaster, environmental degradation and other issues, the problem of urban flooding has been deteriorating. Climate variability and extreme weather events caused by urbanization, including sea level rise, increasing storms and extreme torrential rains, has also made urban flooding more visible.
The development of the city has changed our living environment and the way of life. Whereas, the high-intensity urbanization activities also influence the original climate characteristics where urban rainband gradually formed. Obviously, construction of underground garage, over-exploitation of groundwater and increasing high-rise buildings have made urban areas increasingly vulnerable and exposed to the growing impact from heavy rains, floods and other extreme events. According to Bulletin of Flood and Drought Disasters in China
[2], there is an average of 158 cities above the county level flooded or suffering serious waterlogging annually from 2006 to 2014 in China, where the upward trend is evident.
As a result, urban flooding forecast, rescue and decision-making support are attracting increasing attention from global disaster emergency response management experts and governments. Among that, the role of emergency response decision support in flooding management has become a hot research issue
[3]. In emergency decision making, what decision makers have to face are the limited time and great psychological pressure, so using the cases in the historical flooding case database to provide some experience and information to decision makers can improve the efficiency and quality of emergency response decision making, which saves valuable time and resources for follow-up flooding rescue as well.
Thus, case-based reasoning methods based on the calculation of case similarity can help decision makers to extract historical cases that share much in common with current target case from case base quickly[4, ref5]. In general, the process of CBR consists of two core parts, describing new cases in terms of characteristic attributes of source cases to facilitate retrieval and assigning proper algorithm to calculate the similarities between different cases. Naturally, to build characteristic attributes and similarity algorithm for urban flooding is the task of this paper.
For one, every flooding case is an independent event. In order to utilize case-based reasoning approach to research flooding cases, what we need to do firstly is to construct a measureable attributes system for their basic characteristics. The construction of flooding's characteristic attributes has been studied extensively. Fang, et al.
[6] proposed six aspects to describe flooding cases, affected population, deaths, engineering loss, affected area, collapsed houses and direct or indirect economic loss, in the Chinese flood case databases from 1736 to 1991 they built. Kelsch
[7] illustrated that flash floods are the phenomenon in which the important hydrologic processes are occurring on the same spatial and temporal scales as the intense precipitation. Hadihardaja, et al.
[8] investigated six attributes, rainfall rate, duration, flood area, flood depth, submerged time and travel time, for flooding cases in their decision support system for predicting flood characteristics based on database modeling development.
For another one, case retrieval is the key part in case-based reasoning because it provides the most similar case to the current problem from the case database. The core of case retrieval is to calculate the degree of similarity between source cases and current problem. The general similarity calculation methods include k-nearest neighbors method, decision tree method, knowledge-guided method and so on. Besides that, Zhang, et al.
[9] raised a universal method for describing and organizing emergency cases based on three-tier architecture and designed a kind of similarity algorithm based on two-layer structure according to attribute features of emergency cases to avoid the defect of traditional nearest neighbor algorithm. Liu
[10] designed a geographical case reasoning (GCR) model of integrating case-based reasoning (CBR) and rule-based reasoning (RBR) based on geography information system (GIS) with geographic index method, similarity method, case index and match method. He applied this model to the disasters emergency intelligent system of a pipeline company. Zhong, et al.
[11] focused on the method of case-based reasoning and its application in emergency commanding and decision-making. They analyzed the features and projected the description and storage pattern of emergency cases. Following that, the retrieval algorithm, which is the kernel of CBR, and the process of case-based reasoning in emergency commanding and decision-making was elaborated. Finally, they proposed the CBR prototype system of emergency commanding and decision-making. Wang, et al.
[12] thought a widely accepted approach to assist disaster management is to find and learn the experiences from the similar cases in history. They offered a digital disaster case structure to record the whole procedure of each disaster considering the importance of spatial and temporal information. Zhao, et al.
[13] proposed a new textual case similarity algorithm, sentence vector space model, to avoid the disadvantage that traditional algorithm based on vector space model actually neglected the word order and structure in sentence so that it would affect the accuracy of similarity computing. Fan, et al.
[14] developed a new method for hybrid similarity measure with five formats of attribute values: Crisp symbols, crisp numbers, interval numbers, fuzzy linguistic variables and random variables. Retrieve the proper historical cases according to the obtained hybrid similarities, which are given by aggregating attribute similarities using the simple weighting method.
Overall, the above-described research on the characteristic attributes of flooding cases is lack of consideration about the diversity and complexity of data when different attributes are denoted through various types of data. Meanwhile, emergency cases are typically unstructured with complex data so that the previous studies on similarity calculation in emergency decision-making cannot ensure the validity of calculation when the attributes among cases are inconsistent, especially, for unconventional emergencies.
Therefore, for the stratified data characteristics of urban flooding case, this paper constructs the CPIE-CBR model with different calculating processes designed to attributes of various types of data, which can improve the validity of calculation significantly. The remainder of this paper is organized as follows. First, we describe the CPIE-CBR model in detail, including the four layers, classification filtration, punctiform similarity calculation, interval similarity calculation and entropy weighting method. Then, we discuss the results of our numerical simulations based on the real data from Bulletin of Flood and Drought Disasters in China and make concluding remarks in the end.
2 Model
The attribute data about the case of urban flooding is recognized as an aggregation of diversity and complexity. Different types of data are required to be processed through their adaptive methodologies on similarity measurement, so we stratify these attribute data to construct the CPIE-CBR model to calculate the similarity among various cases of urban flooding.
The CPIE-CBR model is constituted by four layers, classification filtration, punctiform similarity calculation, interval similarity calculation and entropy weighting method. The attribute data processed through the first layer is categorized data, such as the type of city, season and flooding. Obviously, the value of categorized data just show their varying types and it is pointless to compare their value. In the second layer, the adaptive data is measured through ordinal and exact numbers. For example, the intensity of flooding is counted by ordinal numbers because it is defined by grade and the exact numbers mainly involve casualties (affected population, transferred population, deaths and missing population), direct economic loss and duration. As for the data of the third layer, they are intervals, such as the affected area, which is an interval instead of an exact number. Naturally, we propose different similarity calculation algorithm for these different types of data of three layers.
In addition, in order to obtain the ultimate case similarity between the target case and the source ones we also need to assign reasonable weightings to similarity on various attributes. In the fourth layer, we adopt the entropy weight method to determine various attributes similarity. The entropy weight method is a comprehensive evaluation to multiple indicators and objects, whose evaluating results is only up to objective information without the interference from human factors.
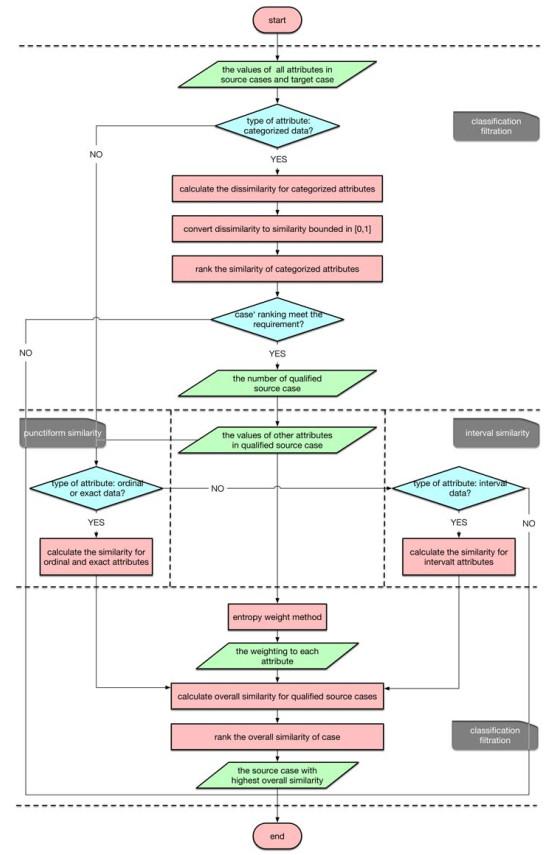
To summarize, the calculation process of the CPIE-CBR model based on the case of urban flooding with stratified data characteristics is showed in Figure 1.
Figure 1 The flowchart of CPIE-CBR model based on the urban flooding cases with stratified data characteristics |
Full size|PPT slide
2.1 Classification Filtration: Utilize Categorized Data to Screen Cases
Similarity and dissimilarity is the important concepts on data mining technology, such as clustering, nearest neighbor classification and deviation detection. Usually, we no longer require raw data once the similarity is calculated so this method can be considered as a process, which transforms the data into similarity (dissimilarity) space before the subsequent analysis. The first layer of the CPIE-CBR model mentioned above is classification filtration. Considering the different types of data among these attributes, this filtration is aimed to perform a coarse filter on the source case base under specific filtering requirement according to the similarity of attributes on categorized data. The process is showed as follow.
Let be the set of source case base, case be the target case and be the set of attributes. Particularly, the set of attributes of categorized data on urban flooding is described as {the type of city, season, the type of flooding}. If the value of attribute in case equals to that in case from source case base, the dissimilarity between these two cases on this attribute is 0, otherwise it is 1. Thus, the dissimilarity matrix for attributes on categorized data about target case in the whole source case base can be obtained as
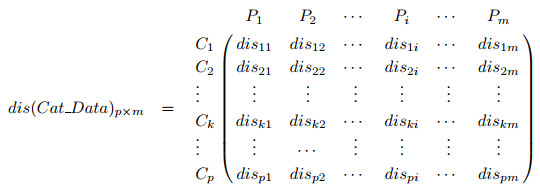
(1)
where is binary. Particularly, if the value of is not unique number among source cases and case , such as is determined from the set for target case but for source case , we assume that when , otherwise it is 0.
Then, we can calculate the total dissimilarity between and by
Since final screening requires the similarity, we will transform dissimilarity to similarity. Generally, the formula is adaptive. But the value of dissimilarity in this paper is determined from the interval . In order to limit the similarity into , we use a nonlinear method
At last, sort these similarities under a specific filtering requirement. For example, we filter out the source case whose is ranked in the second half, so that we will only research the rest of source cases in the next layer.
2.2 Punctiform Similarity: Utilize Punctiform Data to Calculate the Similarity of Attributes
In the second layer, the punctiform data we use include ordinal and exact numbers. For example, the intensity of flooding is counted by ordinal numbers because there is a distinction on its sequence and size even though it is also a result of classifying attributes like categorized data. As for some attributes, like urban population density, casualties (affected population, transferred population, deaths and missing population), direct economic loss and duration, they are described by exact numbers.
We assume that is the value of an attribute in target case and is the corresponding one in a source case . Then the punciform similarity can be defined as
where , is the maximum and minimum values for this punctiform attribute among the whole cases. Thus, we obtain the similarity matrix for punctiform attributes:
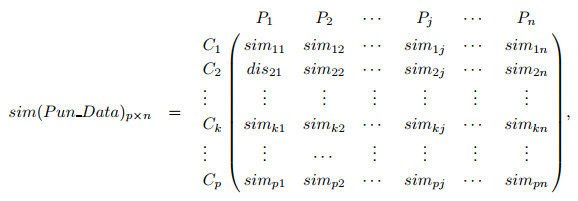
(5)
where is the total number of attributes measured by ordinal or exact numbers.
2.3 Interval Similarity: Utilize Interval Data to Calculate the Similarity of Attributes
However, some attributes on urban flooding are not the exact values, but an interval, so we need a new design for calculating the similarity between two interval attributes. In this section, we refer to the similar algorithm which Zhao, et al.
[15] adopted to solve a missile conceptual design problem.
We assume that the value of attribute in a source case is indicated through an interval, [, ], while that in target case is [, ]. Then the interval similarity is defined as follow:
where . Actually, Formula (6) is the average value of the exact similarity between and in the whole interval. Setting Formula (5) into Formula (6), we obtain:
When , Formula (6) is only up to the value of . Obviously, could have three conditions, , or . When , Formula (7) can be rewritten as
where
Setting Formula (9) into Formula (8), we will obtain
When , Formula (7) can be rewritten as
When , Formula (7) can be rewritten as
Overall, the similarity of interval attributes can formulated as
Obviously, if , exchange the values of , and , respectively, we can still utilize formula (9) to calculate the similarity between [, ] and [, ]. According the formulas described above, we obtain the similarity matrix for interval attributes
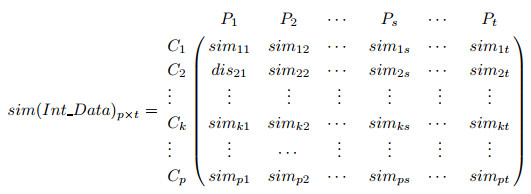
(14)
where is the number of interval attributes and denotes the similarity between target case and source case on interval attribute .
2.4 Entropy Weight Method: Calculate the Weightings Assigned to the Similarity of Attributes
The concepts of entropy involve three domains, physics, molecular motion theory and information theory. In information theory, entropy is a measure to system disorder. When we use it to assign weightings to those attributes, if the values of the attribute fluctuate relatively strongly among the cases, the entropy is relatively small and indicates that this attribute contains much valid information so we will assign larger weighting to it. Conversely, if this attribute has only slight fluctuation, the entropy is large and there is little valid information so its weighting has to be small. Specially, when an attribute has the same value on any case, its entropy will reach the peak, which implies the attribute could provide no valid message to decision making. Naturally, removing it from the attribute index could be recommended.
Therefore, entropy weight method is an objective weighting methodology. In the fourth layer of CPIE-CBR model based on the case of urban flooding with stratified data characteristics, we utilize this method to assign weighting to each attribute about urban flooding. Based on the similarity matrix for attributes of punciform and interval data, we obtain the overall similarity matrix for all the attributes
Then, there are three steps to determine the weightings for attributes:
1) Standardize the raw data. Formula (16) can be recognized as a matrix with attributes and source cases:
Standardize the matrix as
where is the standardized value of the similarity about attributes on source case :
and .
Define entropy. The entropy of attribute among attributes for source cases can be defined as
where , . Let =0 when =0.
3) Define entropy weight. After calculating , we will assign entropy weight for like
where and . Now, through entropy weight method, we obtain the weightings for all the attributes. Naturally, the overall similarity between source case and the target case can be formulated as follow:
Using Formula (21) to traverse all cases which are reserved after the classification filtration in the first layer, we will obtain the overall similarity between target case and every source case. Finally, the source case with high overall similarity will be the outcome of case-based reasoning and selected as the reference for emergency response decision of the target case.
3 Results
According to the definition of flooding in Bulletin of Flood and Drought Disasters in China, the urban flooding we discussed in this paper refers to the flood, waterlogging, flash flood, landslide, debris flow and their secondary disasters happening in cities caused by storm water, snowmelt, jumble ice, dam break, storm surge and tsunamis etc.
In this section, we perform numerical simulations on the above-described CPIE-CBR model to verify its feasibility and effectiveness with the data from Bulletin of Flood and Drought Disasters in China, 2013 and 2014. In the first layer, the categorized attributes include the type of city, type of flooding and season. In the second layer, the punctiform attributes selected are the intensity of flooding, affected population, transferred population, deaths, missing population, direct economic loss, collapsed houses and duration. The only interval attributes in the third layer is the affected area. As for the last layer, it is aimed to assign weightings to the attributes described above so that produce the overall similarity between the target case and each source case. The specific attributes in the first three layers are showed in Table 1.
Table 1 Attributes with stratified data in three layers of the CPIE-CBR model |
| Layer | Type of data | Attribute |
| 1 | Categorized data | Type of city |
| Type of flooding |
| season |
| 2 | Ordinal data | Intensity of flooding |
| Exact data | Affected population |
| Transferred population |
| Deaths |
| Missing population |
| Direct economic loss |
| Collapsed houses |
| Duration |
| 3 | Interval data | Affected are |
In the first layer, we divide the attribute, type of city, into five categories, cities in riverine area, coastal area, alpine zone or mountainous region and cities without significant geographical features. In the attribute, type of flooding, there are ten subdivisions, storm water, flash flood, snowmelt flood, jumble ice, outburst flood, urban waterlog, lake flood, astronomical tide, tsunamis and storm surge. The attribute, season, obviously refer to spring, summer, autumn and winter. In the second layer, the intensity of flooding is measured by the rainfall rate per 24 hours. It can be sorted as drizzle, light rain, moderate rain, heavy rain, extremely heavy rain, torrential rain and extremely torrential rain.
Except that, the attributes, affected population, transferred population, deaths, missing population, direct economic loss, collapsed houses, duration and affected area, denoted through exact numbers or interval require no additional interpretation. We show the real data we use of all attributes in source cases and target case in Table 2 and the interpretation and subdivision for categorized and ordinal attributes in Table 3 respectively.
Table 2 The data of attributes on source cases |
| Layer | Type of data | Attribute | Case 1 | Case 2 | Case 3 | Case 4 | Case 5 | Case 6 | Case 7 | Case 8 | Case 9 | Case 10 | Case |
| 1 | Categorized data | Type of city | 1, 2 | 1, 4 | 1 | 2 | 1, 4 | 1, 2, 4 | 1, 4 | 4 | 1, 2, 4 | 1, 2, 4 | 1 |
| Type of flooding | 1 | 1 | 1 | 10 | 1 | 2 | 1 | 1 | 10 | 10 | 1 |
| season | 1 | 2 | 2 | 2 | 3 | 1 | 2 | 2 | 2 | 3 | 2 |
| 2 | Ordinal data | Intensity of flooding | 7 | 4 | 5 | 7 | 6 | 6 | 7 | 6 | 7 | 7 | 6 |
| Exact data | Affected population | 134.22 | 18.62 | 410.75 | 325.83 | 251.12 | 125.57 | 349.05 | 63 | 837.93 | 982.22 | 318 |
| Transferred population | 24.17 | 0.51 | 54.13 | 38.6 | 12.51 | 0 | 0 | 0 | 126.66 | 82.8 | 3.2 |
| Deaths | 15 | 19 | 19 | 25 | 47 | 39 | 71 | 29 | 50 | 30 | 8 |
| Missing population | 2 | 34 | 3 | 6 | 17 | 7 | 177 | 0 | 4 | 1 | 10 |
| Direct economic loss | 47.54 | 6.13 | 62.88 | 119.52 | 39.07 | 33.58 | 203.09 | 9.46 | 167.06 | 230.82 | 20.5 |
| Collapsed houses | 1.96 | 0.16 | 0.59 | 2.32 | 1.6 | 0.95 | 1.4 | 1.2 | 2.61 | 0.89 | 1.04 |
| Duration | 5 | 5 | 8 | 2 | 4 | 3 | 5 | 7 | 2 | 2 | 4 |
| 3 | Interval data | Affected are | |
Table 3 The interpretation and subdivision for categorized and ordinal attributes |
| Type of city | Riverine area | 1 |
| Coastal area | 2 |
| Alpine zone | 3 |
| Mountainous region | 4 |
| No significant geographical features | 5 |
| Type of flooding | Storm water | 1 |
| Flash flood | 2 |
| Snowmelt flood | 3 |
| Jumble ice | 4 |
| Outburst flood | 5 |
| Urban waterlog | 6 |
| Lake flood | 7 |
| Astronomical tide | 8 |
| Tsunamis | 9 |
| Storm surge | 10 |
| Season | Spring: March, April, May | 1 |
| Summer: June, July, August | 2 |
| Autumn: September, October, November | 3 |
| Winter: December, January, February | 4 |
| Intensity of flooding | Drizzle: < 0.1mm | 1 |
| Light rain: < 10mm | 2 |
| Moderate rain: < 25mm | 3 |
| Heavy rain: < 50mm | 4 |
| Extremely heavy rain: < 100mm | 5 |
| Torrential rain: < 250mm | 6 |
| Extremely torrential rain: 250mm | 7 |
Now, we conduct the numerical simulations. Using the methodology about classification filtration proposed in section two, we filter out the source cases whose similarity on categorized attributes is ranked in the last 30%. According to the calculating result from our simulation, the source case 4, 6 10 was screened out so the rest of source case base will be processed in CPIE-CBR model further.
Next, we calculate the similarity of punctiform attributes and interval attribute in the second and third layers of our model for these qualified source cases in the first layer. The results are showed in Table 4.
Table 4 The punctiform similarity and interval similarity for attributes of urban flooding |
| Layer | Attributes | Case 1 | Case 2 | Case 3 | Case 5 | Case 7 | Case 8 | Case 9 |
| Punctiform similarity | Intensity of flooding | 0.6667 | 0.3333 | 0.6667 | 0.6667 | 1.0000 | 1.0000 | 0.6667 |
| Affected population | 0.7757 | 0.6346 | 0.8868 | 0.9904 | 0.9184 | 0.7651 | 0.9621 |
| Transferred population | 0.8344 | 0.9788 | 0.5979 | 0.7205 | 0.9265 | 0.9747 | 0.9747 |
| Deaths | 0.8889 | 0.8254 | 0.8254 | 0.7302 | 0.3810 | 0.5079 | 0.0000 |
| Missing population | 0.9548 | 0.8644 | 0.9605 | 0.9774 | 0.9605 | 0.9831 | 0.0565 |
| Direct economic loss | 0.8627 | 0.9270 | 0.7848 | 0.4973 | 0.9057 | 0.9336 | 0.0730 |
| Collapsed houses | 0.6245 | 0.6408 | 0.8163 | 0.4776 | 0.7714 | 0.9633 | 0.8531 |
| Duration | 0.8333 | 0.8333 | 0.3333 | 0.6667 | 1.0000 | 0.8333 | 0.8333 |
| Interval similarity | Affected area | 83.8084 | 67.3888 | 60.0912 | 87.4572 | 96.5792 | 72.0639 | 33.8655 |
Then, using the similarity matrix, we obtained in the second and third layers. We assign the entropy weight to each attribute of punctiform data and interval data after the treatment of standardization and normalization (Table 5). Finally, the overall similarities of the seven remaining source cases relating to the target case are showed in Table 6.
Table 5 The entropy weights for attributes |
| Layer | Attributes | Entropy weight |
| Punctiform similarity | Intensity of flooding | 0.1203 |
| Affected population | 0.1233 |
| Transferred population | 0.1193 |
| Deaths | 0.1090 |
| Missing population | 0.0876 |
| Direct economic loss | 0.1003 |
| Collapsed houses | 0.1324 |
| Duration | 0.0977 |
| Interval similarity | Affected area | 0.1102 |
Table 6 The overall similarity between the target case and filtered cases |
| No. | Case 1 | Case 2 | Case 3 | Case 5 | Case 7 | Case 8 | Case 9 |
| Overall Similarity | 9.9404 | 8.0848 | 7.2750 | 10.2676 | 11.4013 | 8.7148 | 4.2530 |
Consequently, Table 6 indicates that the source case 7 has the highest similarity with the target case so that case 7 is recommended as reference case of the target case in our simulations. The whole above-discussed simulation run for 56.9559 seconds in Matlab.
To reflect the strengths of our CPIE-CBR model on the urban flooding case with stratified data, we also test it on the case without stratified characteristics to observe the change on eventual result and running time.
In the first test, we discard the first layer, classification filtration, but reserve the stratification of punctiform similarity and interval similarity. Then, we set all similarities of attributes into the original matrix of entropy weight method (Formula (16)) and obtain the weightings assigned for all attributes showed in Table 7.
Table 7 Entropy weights for all attributes without classification filtration |
| Attribute | Entropy weight |
| Type of city | 0.0835 |
| Type of flooding | 0.1912 |
| Season | 0.1912 |
| Intensity of flooding | 0.0615 |
| Affected population | 0.0615 |
| Transferred population | 0.0534 |
| Deaths | 0.0564 |
| Missing population | 0.0397 |
| Direct economic loss | 0.0794 |
| Collapsed houses | 0.0697 |
| Duration | 0.0607 |
| Affected area | 0.0519 |
Now, we acquire the overall similarity between the target case and all source cases without classification filtration in Table 8 and this time, simulations consume 73.7512 seconds.
Table 8 Overall similarity between the target case and all source cases without classification filtration |
| No. | Case 1 | Case 2 | Case 3 | Case 4 | Case 5 | Case 6 | Case 7 | Case 8 | Case 9 | Case 10 |
| Overall Similarity | 5.0095 | 4.3272 | 3.9378 | 5.5694 | 5.2266 | 4.8658 | 5.7556 | 4.5254 | 2.2523 | 4.4716 |
Obviously, the best recommendation is also case 7 when all source cases have no operation in the first layer so it implies that our CPIE-CBR model has not lost the generality. However, with the pretreatment of classification filtration in the first layer, the running time drops by 16.7953 seconds so that the efficiency of the whole calculation increase by 30%. Thus, we can speculate that under the situation of a massive source case base, if we change the proportion of abandonment from 30% to 50% or higher, the performance of CPIE-CBR model should be better. In the field of emergency management of urgent urban flooding, this model will undoubtedly help decision maker to shorten the decision-making time so that we are accessible to save more lives in the saved time and reduce unnecessary economic losses.
In the second test, we discard not only the first layer, classification filtration, but also the third layer, interval similarity. So, we take the average of maximum and minimum values in the interval of affected area as the new punctiform value for the attributes. Sequentially, the overall similarities change as Table 9.
Table 9 Overall similarity between the target case and all source cases without stratification |
| No. | Case1 | Case2 | Case3 | Case4 | Case5 | Case6 | Case7 | Case8 | Case9 | Case10 |
| Overall Similarity | 0.7054 | 0.8662 | 0.8515 | 0.5802 | 0.7351 | 0.5499 | 0.7956 | 0.8243 | 0.5127 | 0.3899 |
Surprisingly, the results of overall similarities are different from that in the first test and original simulation, which indicates case 2 has the highest similarity with target case. For further analysis, we list the raw data of case 2, 7 and target case to make a detailed comparison in Table 10.
Table 10 The comparison between the target case and case 2, 7 on all attributes |
| Type of Data | Attribute | Caes 2 | Case 7 | Case T |
| Categorized data | Type of city | 1, 4 | 1, 4 | 1 |
| Type of flooding | 1 | 1 | 1 |
| Season | 2 | 2 | 2 |
| Ordinal data | Intensity of flooding | 4 | 7 | 6 |
| Exact data | Affected population (ten thousand) | 18.62 | 349.05 | 318 |
| Transferred population (ten thousand) | 0.51 | 0 | 3.2 |
| Deaths | 19 | 71 | 8 |
| Missing population | 34 | 177 | 10 |
| Direct economic loss (hundred million of yuan) | 6.13 | 203.09 | 20.5 |
| Collapsed houses (ten thousand) | 0.16 | 1.4 | 1.04 |
| Duration (days) | 5 | 5 | 4 |
| Interval data | Affected area (thousand hectares) | 6.5–7.5 | 160–170 | 145–155 |
In Table 10, we find the two source cases have no significant difference in type of city, type of flooding, season, transferred population and duration. However, case 7 is more consistent with the target case than case 2 in affected population, collapsed houses and affected area while less consistent in deaths, missing population and direct economic loss. Overall, the CPIE-CBR model is more effective regarding the tradeoff between the accuracy and efficiency, especially for interval attributes.
4 Conclusions
In this study, we investigate the characteristic attributes with stratified data of urban flooding case and construct the CPIE-CBR model to calculate the similarity between target case and source cases. In the proposed model, there are four layers to process the source cases in order to obtain the overall similarity to provide recommendation to decision makers. Furthermore, based on the numerical simulation, CPIE-CBR model offer a valid solution and an efficient performance.
Through numerical calculation, we observe the following findings: (i) The CPIE-CBR model run faster than the algorithm without classification filtration at the beginning by 30%. So, we can provide the effective information for decision makers more quickly in limited time, which saves valuable time for urban flooding relief. (ii) Considering the interval data is different from the punctiform ones, if the interval data is converted into the punctiform just according to the mean value, the partial information of the interval data will be lost so consequently affect the accuracy of the similarity calculation. In the third layer of CPIE-CBR model, interval similarity calculated through definite integral performs more validly with the target case. (iii) In the previous study of flooding case-based reasoning, the weighting of each attribute is often assigned by the scoring from experts, but this method is often doped with subjective factors. Thus, the information entropy is used in this paper to measure the effective information offered by the data and determine the weightings of each characteristic attribute of urban flooding by entropy weight method to improve rationality in calculation.
Because of the tide of urbanization in the world, more floodplains are being used for urban development. Therefore, emergency management for urban flooding becomes an important cornerstone to support the strategy for future urbanization. As we all know, urban flooding occurs accompanied by strong uncertainty, rapid expansion and massive destructiveness so governments are required to make response in limited time. If the optimal action could not be taken, urban flooding would cause more damage to the cities, and even lead to secondary disasters. Whereas, due to the limitation of decision makers' capacity and knowledge, it is difficult for them to grasp the comprehensive information in a short time and analyze the situation quickly to make the best decision. But fortunately, many urban flooding cases in the history can provide us with experience on operating on disaster prevention and mitigation. The proposed model can be applied to extract the similar historical cases to offer the optimal reference to decision makers.
However, the operation after case matching is also the key process in disaster relief. Therefore, it would be a potential direction to ameliorate the research on urban flooding and disaster emergency management.
{{custom_sec.title}}
{{custom_sec.title}}
{{custom_sec.content}}
 PDF(250 KB)

 Figure 1 The flowchart of CPIE-CBR model based on the urban flooding cases with stratified data characteristics
 Table 1 Attributes with stratified data in three layers of the CPIE-CBR model


