A New K-Shell Decomposition Method for Identifying Influential Spreaders of Epidemics on Community Networks

Kai GONG, Li KANG

Journal of Systems Science and Information ›› 2018, Vol. 6 ›› Issue (4) : 366-375.

PDF(338 KB)
PDF(338 KB)
Journal of Systems Science and Information ›› 2018, Vol. 6 ›› Issue (4) : 366-375. DOI: 10.21078/JSSI-2018-366-10
 

A New K-Shell Decomposition Method for Identifying Influential Spreaders of Epidemics on Community Networks

Author information +
History +

Abstract

An efficient method for the identification of influential spreaders that could be used to control epidemics within populations would be of considerable importance. Generally, populations are characterized by its community structures and by the heterogeneous distributions of out-leaving links among nodes bridging over communities. A new method for community networks capable of identifying influential spreaders that accelerate the spread of disease is here proposed. In this method, influential spreaders serve as target nodes. This is based on the idea that, in k-shell decomposition method, out-leaving links and inner links are processed separately. The method was used on empirical networks constructed from online social networks, and results indicated that this method is more accurate. Its effectiveness stems from the patterns of connectivity among neighbors, and it successfully identified the important nodes. In addition, the performance of the method remained robust even when there were errors in the structure of the network.

Key words

complex networks / community structure / k-shell decomposition / influential spreaders

Cite this article

Download Citations
Kai GONG , Li KANG. A New K-Shell Decomposition Method for Identifying Influential Spreaders of Epidemics on Community Networks. Journal of Systems Science and Information, 2018, 6(4): 366-375 https://doi.org/10.21078/JSSI-2018-366-10

1 Introduction

Epidemics can lead to serious loss of life and they have huge an impact on the economy[1], as witnessed during the 2003 outbreak of severe acute respiratory syndrome (SARS)[2, 3], the 2009 outbreak of H1N1 influenza A virus[4], and the 2013 outbreak of H7N9 Influenza A virus[5]. Knowledge regarding the pathways by which diseases spreading through networks and how this network might be used to prevent epidemics is of great importance. This issue has attracted a great deal of attention from researchers across various fields[6, 7]. Identifying the influential spreaders that can hinder the spread of disease effectively so as to suppress outbreaks remains an open issue[8].
Hubs, individuals who have high centrality in networks, are commonly believed to be the most influential nodes in the spreading process because they can affect many neighbors[911]. In the case of networks with broad-degree distribution[12], the degree for the well-connected individuals has been shown to be an efficient method of identifying efficient spreaders[9, 10], Betweenness is another centrality. It involves measuring the number of shortest paths that cross the current node. It has been used to determine who has the most influence on others in networks[11, 13]. However, Kitsak, et al. pointed out that the most efficient spreaders are those located within the core of a network as targeted by the k-shell decomposition method[6]. This method is based on iterative pruning of nodes with degree smaller than or equal to the kcore index of the current layer until each node is associated with kcore index that reflects the core or periphery layer in network[14].
Community structure[15] is ubiquitous in complex networks[16], such as Facebook[17] and Twitter[18]. It serves an important function in the dynamics of epidemic[1921]. In the presence of community structures, heterogeneous distribution of out-leaving links was observed among real networks, such as air traffic networks[22], social networks[23], and communication networks[24]. The out-leaving links connecting a pair of nodes belonging to different communities have been found to provide shortcuts from one community to another[2527]. These links have been proven to be more efficient in diffusing diseases through network[28]. Identifying the influential spreaders in community networks is quite challenging because the mesoscopic features of the community structure are complex. Here, a k-shell with community method is proposed. This new method, based on the idea of the k-shell decomposition process, involves identifying the influential spreaders using two types links. Results demonstrated that the proposed method performs better in empirical networks than degree, betweenness, and k-shell decomposition strategies do. Simulation also shows that this method has the merit of being significantly robust against noise.

2 Data and Model

The present paper compares results based on the current method and identifying efficient spreaders in empirical networks within epidemiological models. First, details are given with respect to the following issues: Network construction and dynamic model.

2.1 Network Construction

Empirical networks are constructed using online collegiate social data from Facebook (https://code.google.com/p/socialnetworksimulation). Data from universities in U.S. was studied here. It includes anonymous data from students from Caltech, Princeton, Georgetown, and the University of Oklahoma. The data concern the dormitories, majors, and year for each individual, and dormitories were found to be key elements in the social organization of large universities[17]. Based on these data, the networks were constructed by linking up pairs of individuals who (i) were online friends and lived in the same dormitory, or (ii) they lived in different dormitories but had the same major and year. The giant network was then used for the present study. Basic statistical properties of networks are given in Table 1. In here, degree heterogeneity was calculated using the equation proposed by Hu[29], and, for every network, community structure was detected by Louvain algorithm[30]. All networks exhibited small-world characteristics with high clustering coefficient and short average path length. They also had high modularity.
Table 1 Structural properties of networks
Network N E < k > kmax < d > C r H G Q
Caltech 571 7127 24.96 96 2.96 0.57 0.01 0.36 9 0.79
Princeton 3975 23457 11.80 129 4.721 0.32 0.41 0.43 30 0.74
Georgetown 6309 73022 23.14 311 4.21 0.25 0.24 0.45 16 0.68
Oklahoma 6850 152985 44.66 247 4.36 0.52 0.48 0.51 42 0.92
Structural properties including the network size (N), number of edges (E), average degree (<k>), max degree (kmax), average shortest path length (<d>), clustering coefficient (C), degree assortativity (r), degree heterogeneity (H), the number of communities (G), and modularity (Q) are tabulated for each networks. These networks include data from the California Institute of Technology, Princeton University, Georgetown University, and the University of Oklahoma.

2.2 Dynamic Model

In the susceptible-infected-recovered (SIR) model, each node in each network represented an individual who could be in one of three states: susceptible, infected, or recovered, and each link between nodes represented one connection that could spread an infection. Initially, all nodes were susceptible. To initiate an infection, one node was randomly chosen and considered infected. In every time step, each infected individual randomly contacts two neighbors, and β = 0.08 is the probability of a susceptible neighbor would be infected. The probability that an infected node would recover was γ= 0.2. Once an individual was recovered, there would be no further change. In the simulation, states of every node were updated synchronously. The dynamics ended when all infected recovered. The average size of the infected, M, and the fraction of the population ever infected at the end of the epidemic were recorded, allowing quantification of the influence of given node on spreading process.

3 Methods

3.1 Identification Methods

The ideas behind degree (k), betweenness (cb), and k-shell decomposition method (kcore) are outlined, and the current method is discussed. Briefly, degree was based on the idea that most influence nodes would be those with the largest number of connections, and it is one measure of local influence: only the structure around the node has to be considered[31]. Betweenness measures the number of shortest paths from all nodes to others that cross through that node. Kitsak, et al. argued that the structure of network organization serves an important function such that there are plausible circumstances under which the most degree or highest betweenness as influential spreaders have the least pronounced impact on the spreading process[6]. K-shell decomposition is one method based on iteratively pruning of nodes with degree no more than kcore of the current layer. The highest kcore index is closely related to the concept of most influential nodes on spreading process. They used the method by identifying the core and periphery of given node in real network to identify key spreaders and found that k-shell decomposition method is more accurate.

3.2 A New k-Shell Decomposition Method

The k-shell with community method is here proposed as a means of more effective identification. It is based on the idea that k-shell decomposition involves both out-leaving links and inner links. This method starts with successive pruning of the network by removing nodes with two types links separately. This process has three main components: (ⅰ) Removal of nodes with out-leaving links, (ⅱ) removal of nodes with inner links, and (ⅲ) assignment of values.
(ⅰ) After initialization of networks by removal of all nodes with inner links, all nodes with out-leaving links ko = 1 among nodes bridging over communities were then removed, and some nodes with out-leaving links may have remained, so we continued pruning the network repeatedly until there was no node left with ko = 1 in the network. These nodes are associated with an index kcoreo = 1. In a similar step in the original work, the next level, ko = 2, was iteratively removed and the system continued removing higher ko until all nodes were associated with an index of kcoreo.
(ⅱ) After initialization of networks by removal of all out-leaving links, a procedure analogous to previous component was repeated by removing nodes with inner links ki = 1 until there were no nodes left with ki = 1. These nodes are associated with an index of kcorei = 1. The procedure was repeated until each node was associated with an index kcorei.
(ⅲ) Finally, the values kcorem was assigned to each node. It can be defined using the following equation:
kcorem(j)=kcorei(j)+kcoreo(j)2.
(1)

4 Results

4.1 Heterogeneity in Empirical Networks

To illustrate the necessity of an identification method that focuses on the most efficient spreaders in networks using heterogeneous distributions, the distributions of the cumulative probability density were analyzed are by out-leaving links and inner links in real networks are denoted (Figure 1). The phenomenon of heterogeneity indicates that nodes have significantly different according to their pattern. This phenomenon also indicates the striking influence that heterogeneity has on the spreading process.
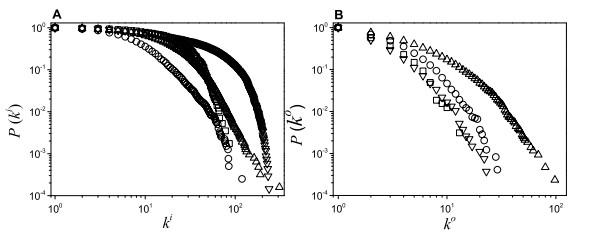
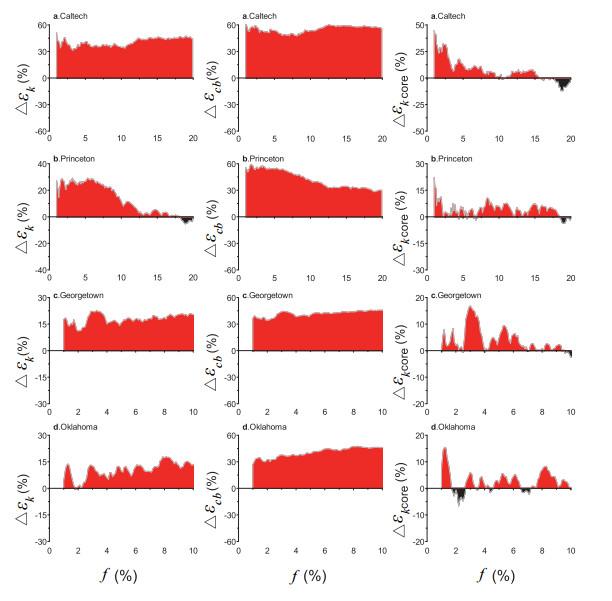
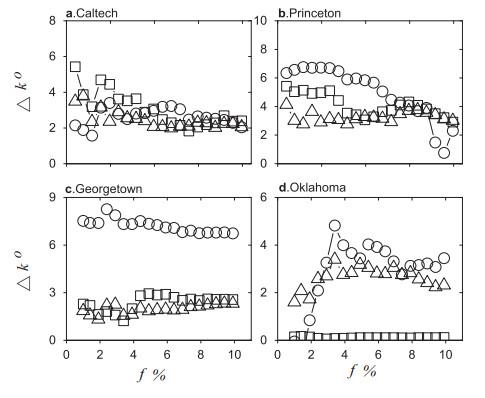
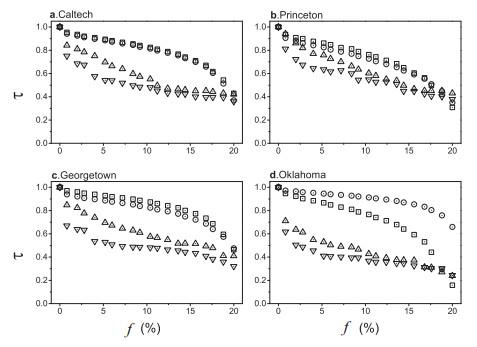
Figure 1 Cumulative distribution of out-leaving links and inner links in empirical networks

Full size|PPT slide

In Figure 1, for every network, community structure was detected by Louvain algorithm in [29]. The out-leaving links and inner links were then identified, and the number of out-leaving links ko and inner links ki emanating from each node were recorded to give the cumulative distribution. Empirical results are shown for Caltech (squares), Princeton (circles), Georgetown (upward-facing triangles), and the University of Oklahoma (downward-facing triangles).

4.2 Comparison of Spreading Efficiency

To compare the efficiency of k, cb, and kcore with that of our method, the SIR was performed on empirical networks. The imprecision function ε, in the previous work[6], quantifies the difference between the average infected between the fN nodes (0 < f < 1) with the highest k, cb, kcore, kcorem, and the average infected of the fN most efficient spreaders. For a given fraction f the set of the fN most efficient spreaders was first identified as measured by Meff. (designated Feff). Similarly, the fN nodes with the highest kcorem (Fkcorem) were identified. In this way, the imprecision of kcorem can be defined as follows:
εkcorem=1MkcoremMeff.
(2)
Here, Mkcorem and Meff are the average infected percentages over the Fkcorem and Feff sets of nodes, respectively. εkcorem approaches 0, an indication that the highest nodes are chosen by the strategy and are usually those that contribute the most to epidemics, and vice versa. εk, εcb, and εkcore are defined similarly to εkcorem. Here, the differences Δεx (x denoting k, cb, kcore) would indicate the spreading efficiency of strategy relative to the proposed method in the fN set can be defined using the following equation:
Δεx=εxεkcoremεx.
(3)
In most cases, the differences of Δ are positive over almost all of the set of different strategies (Figure 2). For example, kcorem was on average 7.66% (40.43%, 55.06%) higher than kcore (k, cb) for the Caltech data set, 5.28% (12.91%, 42.19%) higher for the Princeton set, 5.66% (17.88%, 41.65%) higher for the Georgetown set, and 4.93% (15.48%, 40.34%) higher for the University of Oklahoma set.
Figure 2 Comparison of spreading efficiency of identification in empirical networks

Full size|PPT slide

In Figure 2, the difference in imprecision Δεx, x denoting k (left panel), cb (middle panel), and kcore (right panel), are shown for each networks as function of f. The positive percentages shows that kcorem is more accurate. Results are obtained by averaging over 2000 for each node.

4.3 Comparison of Average Out-Leaving Links Among Neighbors

As spreaders, whether it has influence on spreading process is closely related to its pattern of connections in speeding up the transmission of epidemics. The effectiveness of kcorem is illustrated in Figure 3, which compares the out-leaving links among neighboring nodes identified using different strategies in networks. Here, the set Γ is the union of neighbors of nodes those identified by method. Let <ko>(Γx), with x denoting method, be the average out-leaving links within the union Γ after applying said method. The difference Δko is the measure of how effective kcorem identify bridge hubs within networks. This can be defined using the following two equations:
Δko=<ko>(Γkcorem)<ko>(Γx).
(4)
Figure 3 Comparison of average out-leaving links among neighbors of nodes identified by kcorem with those others

Full size|PPT slide

As shown in Figure 3, Δko in almost all the cases indicates that nodes identified by kcorem have more extensive connections of neighbors with well-connected than other strategies do, improving the effectiveness of identification for efficient spreaders. But, in Oklahoma case also shows that nodes identified by kcorem have comparable out-leaving links of neighbors with kcore, that make the curves are fluctuated in the right rows of Figure 2, even kcorem is still better than kcore in most cases.
In Figure 3, the difference Δko in out-leaving links with x denoting k (circles), cb (upward-facing triangles) and kcore (squares) of neighbor set Γ are shown for different f in empirical networks.

4.4 Robustness of the Method

Another important aspect of an effective method is the robustness to missing or noise information. Such errors are common in real networks due to, for example, the inconsistency with which two individuals describe their relationship[32].
Using empirical networks, the incomplete information by randomly removing the percentage of connections, then have tested the robustness by using Kendall rank correlation coefficient τ (1τ 1)[33], which measures the similarity of the ordering of nodes when ranked by on the incomplete and original network. Using empirical networks, the kcorem values re-calcuted after removing the percentage of connection, then have tested the robustness by using Kendall correlation coefficient. This can be defined using the following equation:
τ=number of concordant pairsnumber of discordant pairsN(N1)/2.
(5)
τ similar to 1 denotes an exact agreement between two ranks for both elements, and vise-verse. The robustness of the proposed method is indicated by the relatively higher τ values in Figure 4. In most cases, both the proposed method and kcore yield comparable robust results, and k and cb both perform poor.
Figure 4 Robustness of the methods in networks with noise as modeled by random removal of connections

Full size|PPT slide

In Figure 4, results are shown for kcorem (squares), kcore (circles), k (upward-facing triangles) and cb (downward-facing triangles), by averaging over 2000 realizations.

5 Conclusions

The heterogeneity distribution of out-leaving links and inner links under real-world conditions is important to identifying those nodes which are most influential spreaders in the transmission of diseases, but these nodes are difficult to identify in community networks. In summary, the new k-shell decomposition method proposed here was studied for effectiveness. There is one method for identifying nodes. This method is based on the idea that k-shell decomposition involves both out-leaving links and inner links. The current method was used to empirically tested networks among students in U.S. universities constructed by using online social networks. In most cases, the current method were found to be more effective in identifying influential spreaders than degree, betweenness, and k-shell for the range of the set, and results were more accurate. Its effectiveness can be attributed to the neighbors identified by our method because the pattern of connections among neighbors was more striking than those produced using other strategies. For this reason, it can spread through the entire network more quickly and effectively. The current method kept its stability well throughout the missing processes, and has also been strongly performed robustness.

References

1
Keeling M J, Rohani P. Modeling infectious diseases in humans and animals. Princeton University Press, 2008.
2
Gomez G J, Latora V, Moreno Y, et al. Spreading of sexually transmitted diseases in heterosexual populations. Proceedings of the National Academy of Sciences of the United States of America, 2008, 105 (5): 1399- 1404.
3
Colizza V, Barrat A, Barthelemy M, et al. The role of the airline transportation network in the prediction and predictability of global epidemics. Proceedings of the National Academy of Sciences of the United States of America, 2006, 103 (7): 2015- 2020.
4
Fraser C, Donnelly C A, Cauchemez S, et al. Pandemic potential of a strain of influenza a (H1N1): Early findings. Science, 2009, 324 (5934): 1557- 1561.
5
Salathe M, Freifeld C C, Mekaru S R, et al. Influenza a (H7N9) and the importance of digital epidemiology. The New England Journal of Medicine, 2013, 369 (5): 401- 404.
6
Kitsak M, Gallos L K, Havlin S, et al. Identification of influential spreaders in complex networks. Nature Physics, 2010, 6 (11): 888- 893.
7
Salathe M, Jones J H. Dynamics and control of diseases in networks with community structure. Plos Computational Biology, 2010, 6 (4)
8
Ghoshal G, Barabasi A L. Ranking stability and super-stable nodes in complex networks. Nature communications, 2011, 2 (394)
9
Pastor S R, Vespignani A. Epidemic spreading in scale-free networks. Physical Review Letters, 2001, 86 (14): 3200- 3203.
10
Cohen R, Erez K, Ben A D, et al. Breakdown of the internet under intentional attack. Physical Review Letters, 2001, 86 (16): 3682- 3685.
11
Goh K I, Oh E, Kahng B, et al. Betweenness centrality correlation in social networks. Physical Review E, 2003, 67, 017101.
12
Barabasi A L, Albert R. Emergence of scaling in random networks. Science, 1999, 286 (5439): 509- 512.
13
Freeman L. Centrality in social networks conceptual clarification. Social Networks, 1978, 1 (3): 215- 239.
14
Carmi S, Havlin S, Kirkpatrick S, et al. A model of internet topology using k-shell decomposition. Proceedings of the National Academy of Sciences of the United States of America, 2007, 104 (27): 11150- 11154.
15
Fortunato S. Community detection in graphs. Physics Reports, 2010, 486 (3-5): 75- 174.
16
Girvan M, Newman M E J. Community structure in social and biological networks. Proceedings of the National Academy of Sciences of the United States of America, 2002, 99 (12): 7821- 7826.
17
Traud A L, Kelsic E D, Mucha P J, et al. Comparing community structure to characteristics in online collegiate social networks. SIAM Review, 2011, 53 (3): 526- 543.
18
Goncalves B, Perra N, Vespignani A. Modeling users activity on twitter networks: Validation of dunbar's number. Plos One, 2011, 6 (8): e22656.
19
Zonghua L, Bambi H. Epidemic spreading in community networks. Europhysics Letters, 2005, 72 (2): 315.
20
Wu X, Liu Z. How community structure influences epidemic spread in social networks. Physica A, 2008, 387, 623- 630.
21
Huang L, Park K, Lai Y C. Information propagation on modular networks. Physical Review E, 2006, 73 (3): 035103.
22
Guimera R, Mossa S, Turtschi A, et al. The worldwide air transportation network: Anomalous centrality, community structure, and cities global roles. Proceedings of the National Academy of Sciences of the United States of America, 2005, 102 (22): 7794- 7799.
23
Arenas A, Borge H J, Gómez S, et al. Optimal map of the modular structure of complex networks. New Journal of Physics, 2010, 12 (5): 053009.
24
Onnela J P, Saramaki J, Hyvonen J, et al. Structure and tie strengths in mobile communication networks. Proceedings of the National Academy of Sciences of the United States of America, 2007, 104 (18): 7332- 7336.
25
Granovetter M. The strength of weak ties. The American Journal of Sociology, 1973, 78 (6): 1360- 1380.
26
Gong K, Tang M, Yang H, et al. Variability of contact process in complex networks. Chaos, 2011, 21 (4): 043130.
27
Gong K, Tang M, Hui P M, et al. An efficient immunization strategy for community networks. Plos One, 2013, 8 (12): e83489.
28
Hebert D L, Allard A, Young J G, et al. Global efficiency of local immunization on complex networks. Scientific reports, 2013, 3, 2171.
29
Hu H B, Wang X F. Unified index to quantifying heterogeneity of complex networks. Physica A, 2008, 387 (14): 3769- 3780.
30
Blondel V D, Guillaume J L, Lambiotte R, et al. Fast unfolding of communities in large networks. Journal of Statistical Mechanics: Theory and Experiment, 2008, (10): P10008.
31
Latora V, Marchiori M. A measure of centrality based on network efficiency. New Journal of Physics, 2007, 9 (6): 188.
32
Lu L, Zhang Y C, Yeung C H, et al. Leaders in social networks, the delicious case. Plos One, 2011, 6 (6): e21202.
33
Kendall M G. A new measure of rank correlation. Biometrika, 1938, 30, 81- 93.

Funding

Fundamental Research Funds for the Central Universities(JBK170133)
Natural Science Foundation of Sichuan Province of China(17ZB0434)
Ministry of Education of Humanities and Social Science Foundation of China(11XJCZH002)
PDF(338 KB)

170

Accesses

0

Citation

2

Altmetric

Detail

Sections
Recommended

/