1 Introduction
The Beijing-Tianjin-Hebei region is the region with the best economic development and the highest degree of modernization in the north of China. As coordinated development of this region has become a national priority, the economic development of urban agglomerations in the region is critical to lead the economic development of the northern region and increase China's comprehensive strength.
High-quality development of the economy is closely related to optimization of the industrial structure, but the existing industrial structure is untenable. Industry in the Beijing-Tianjin-Hebei region lacks close collaboration; there is imbalance, leading to some industries having excess capacity; and the region's economic development is based on each industry's resource structure and regional advantages. The phenomenon of industrial assimilation is serious, and gaps in the level of regional industrial structure are obvious. The industrial relationships in the region are unbalanced, and the agricultural part of the primary industry mainly comes from Hebei Province. In the secondary industry, Hebei and Tianjin take advantage of their own environments and regional advantages to occupy larger shares of the output. With a high density of science, technology and innovative talents, Beijing has an absolute advantage in tertiary industry. In the internal structure of tertiary industry in Beijing, the value added of the financial industry is the largest, followed by those of information transmission, software and information technology services, wholesale and retail. In Tianjin, the financial sector in tertiary industry is dominant, while the largest shares of tertiary industry in Hebei Province are wholesale, retail, transportation, and warehousing.
The Beijing-Tianjin-Hebei region's labor-intensive industry structure, heavy chemical industry structure, coal-based energy structure and road transportation structure have not been fundamentally changed. The level of industrial technology is relatively low, the innovation ability is insufficient, the level of industrial structure is low, and industrial agglomeration and industrial scale effect cannot be effectively exerted. As a result, the industrial structure has only slowly become highly evolved.
The Beijing-Tianjin-Hebei region has had the worst levels of environmental pollution in the country for many years. Overall pollution has continued to increase, and the regional ecological system is in a sub-healthy state, with high energy use and high pollution, inefficient and extensive release modes of economic growth are still dominant, and emissions of the "three wastes" of traditional industry have placed great pressure on the environment. Economic growth is increasingly constrained by energy and resources, and the ecologicalization of the industrial structure is proceeding slowly.
The rationalization of the industrial structure reflects the demand for industrial structure quantity, which reflects the need for the development of the industrial structure to adapt to the level of economic and social development. The sophistication of industrial structure reflects the requirements of the industrial structure and embodies the rules and trends of industrial structure evolution and development. Elevating the industrial structure without rationalizing it will cause the "hollowing out" and thereby the regression of the industrial structure. Sophistication of the industrial structure is conducive to its rationalization at a higher level. If rationalization of the industrial structure cannot be realized timely, this will lead to the "time-lag" of the industrial structure and hinder its development.
Making the industrial structure more ecological through the alternate development of industries at different levels of ecological performance, improving the degree of ecological correlation and coordination between industries, and promoting the rational allocation and flow of ecological elements between industries are conducive to the rationalization and sophistication of the industrial structure. Through sophistication of the industrial structure, its transition from a low to a high level is realized, and rationalization of the industrial structure is used to improve the transformation ability between different industries, which also helps raise the ecological level of the industrial structure.
Compared with the Yangtze River Delta and the Pearl River Delta, as Beijing-Tianjin-Hebei is China's important economic growth region, imbalances in its regional distribution of public resources and economic development among cities are more outstanding, and the degree of integration is relatively low. It is critical to determine how to gain a foothold in the Beijing-Tianjin-Hebei with respect to its regional comparative advantages, industrial division requirements, the principle of complementary advantages and the win-win concept, with the construction of the Beijing-Tianjin-Hebei region as the carrier and the overall planning elements of space utilization of resources as the main line to optimize regional division of labor and industry and increase the degree of rationalization of the industrial structure. It is also important to identify how to raise the level of the manufacturing industry, vigorously develop a high-tech advanced manufacturing industry, and raise the level of the industrial structure through identifying the right positioning, coordinated development and industrial connection. It is also critical to determine how to give full play to comparative advantages of resources, carry out trans-regional infrastructure construction, optimize industry and population distribution, focus on expanding environmental capacity and ecological space, strengthen cooperation in ecological and environmental protection, build a long-term institutional mechanism for natural resource protection, and improve the ecologicalization of the industrial structure in both breadth and depth. Through the optimization and upgrading of the industrial structure, improving the level of sophistication, rationalization and ecologicalization of the industrial structure and promoting regional economic and social development have become an important part of the coordinated development of the Beijing-Tianjin-Hebei region.
2 Literature Review
2.1 Industrial Structure and Economic Growth
Gan, et al. used the econometric model to measure the impact of changes in China's industrial structure on economic growth and volatility. The analysis results showed that the industrial structure rationalization and high-grade process impact on economic growth have obvious stage characteristics; at present our country's industrial structure rationalization is making a greater contribution to economic development than the sophistication of the industrial structure
[1]. Guo and Deng employed the Shift-share Method (SSM) and found that economic growth mainly depends on the share of industrial structure transition
[2]. Han, et al. analyzed the driving mechanism and effects of industrial structure optimization and upgrading on the ecological efficiency of provinces from the perspective of local effects and interregional interaction
[3]. Lu and You studied the impact of changes in industrial structure on the transformation of the economic growth mode in South Korea and found that in the country's industrialization period, the rationalization of the industrial structure had a more sustainable driving effect on economic growth, while the positive impact of the upgrading of the industrial structure on economic growth was more stable
[4]. Liu and Zhang separated technological progress and industrial structure change from decomposition factor productivity; their empirical research found that the contribution to economic growth of industrial structure change with the improvement of marketization degree and declining trends gradually gives way to the contribution of technological progress
[5]. Based on interprovincial panel data from 1978 to 2010, Peng, et al. selected the panel vector autoregression model to study the dynamic impact of changes in the industrial structure on economic fluctuations and found that the rational impact of industrial structure showed weak inverse periodicity while the high-level impact showed strong pro-periodicity
[6].
2.2 Application of the Grey Relational Degree Analysis Method in Industrial Structure Optimization Measurement
Chen, et al. took six construction areas of smart cities as evaluation indicators and used grey correlation analysis and cluster analysis to empirically study the unbalanced characteristics of construction in various fields of smart cities in China
[7]. Wang, et al. used the grey correlation degree to empirically analyze the correlation between energy consumption and energy consumption types with economic growth in various industries in Xinjiang. They found that there are significant differences between energy consumption and economic growth in different industries
[8]. Liu, et al. studied the internal industry of the Beijing-Tianjin-Hebei region with the method of location entropy grey correlation degree
[9]. Sun and Zhao used 2013–2015 data from each district and adopted the TOPSIS method and the grey correlation model to explore the grey correlation between population dispersal and economic development. The study found a high degree of grey correlation between economic development quality and population dispersal but that there are differences between the regions as well as synergies
[10]. Based on time series statistics from 1978 to 2016, Zhang, et al. studied the impact of the urbanization rate and changes in the industrial structure on economic growth and found a long-term equilibrium relationship between them
[11]. Hu, et al., based on panel data on the 1997–2016 Chongqing industrial structure and land economy density and using the grey correlation analysis and coordination degree model, discussed the industry structure and the interaction of land economic density and inner link. The study found an imbalance among industrial structure and land economic density, weak coordination, and coordinated evolution
[12]. Wang, et al., based on relevant data on energy consumption and economic growth in Liaoning province from 2000 to 2012, adopted the grey correlation analysis method to conduct an empirical analysis of the correlation between the energy consumption industry and energy consumption varieties with economic growth in Liaoning province
[13]. Using the Shandong economy as their research object, Zhang used the grey correlation model to analyze the correlation between economic development and different energy consumption from 2000 to 2009, such as the correlation between the development of the economy and coal, oil, electric power and new energy. That study showed that new energy consumption has a strong correlation with economic development
[14].
From the above literature review, it can be seen that, first, most scholars study the optimization and upgrading of the industrial structure from the relationship between the rationalization and sophistication of the industrial structure and economic growth, combined with different regions and provinces, rarely considering the ecological level of industrial structure. Second, the existing research mostly focuses on the study of national or provincial industrial structure. Because of the important role of urban agglomeration in promoting new urbanization and coordinated development of regional economies, it is necessary to measure and analyze the industrial structure of the Beijing-Tianjin-Hebei region from the perspective of urban agglomeration. In this paper, by using the grey correlation model, according to the convention of the adjustment of industrial structure optimization; constructing the sophistication, rationalization and ecologicalization of regional industrial structure; and coupling of the three core indexes and economic growth phases, this paper makes a comprehensive estimation of the Beijing-Tianjin-Hebei region industrial structure optimization index, providing the basis of an objective and reasonable estimation method to be used for reference in subsequent research.
3 Methodology
A grey system refers to a system between a white system in which information is completely clear and a black system where information is completely unknown. A grey system is mainly used to deal with the problem of partial information transparency and part of the information being unknown. Its principle is to use the white transparent information to help determine the unknown black information. The grey correlation analysis is a method to judge the correlation degree of factors according to the similarity degree of the geometric shape of each factor change curve. The grey relational analysis obtains the grey relational degree between the reference sequence and the comparison sequence through the geometric comparison of the relevant data of time series in the system. The greater the correlation coefficient between the compared sequence and the reference sequence is, the closer its development direction and speed are to the reference sequence, and the closer the relationship between them is. In practice, the grey relational analysis method does not require regularity in the time variation of the sample data of the research object and is thus easy to use and widely applied. The basic idea of grey correlation analysis is to conduct dimensionless processing of the original observation data of the evaluation index, calculate the correlation coefficient and correlation degree of the main sequence and related sequence, and sort the evaluation index according to the magnitude of correlation degree.
3.1 Model Building
The grey model can make relatively accurate predictions under the condition of incomplete information and realize the correct description and effective monitoring of the system's running state and evolution rule. It has good fitting and extrapolation characteristics and can reflect the actual situation of the system well. The boundary and extension information of the industrial structure system are fuzzy and have greyscale characteristics, which meet the requirements of the grey dynamic correlation model
. Therefore, referring to the research of Liu and Hao
[15], on the basis of the multiobjective model of industrial structure, this paper constructs the
model of each subsystem and further explores the self-development ability of each subsystem and the collaborative development status among them.
Assuming that industrial structure system has subsystems with order parameters and the -th subsystem has order parameters, each subsystem in the sample period can be expressed as:
By weighting each order parameter in subsystem linearly, the comprehensive evaluation index of the subsystem can be obtained.
where represents the weight of the order parameter in the subsystem of the industrial structure in the subsystem.
Each subsystem constitutes the sequence of of the industrial structure system .
Let be the 1-AGO sequence of :
where = , .
In the subsystem, is the behavior variable (explained variable), and the remaining sequence is the factor variable (explained variable).
Let be the adjacent mean generation sequence of :
Then, the model can be expressed as:
is called the system self-development coefficient, is called the driving coefficient, and is called the driving term where measures the self-development degree of subsystem of industrial structure. If , it indicates that subsystem has self-development ability. In contrast, if , it indicates that subsystem has no self-development ability. represents the driving effect of the industrial structure subsystem on the industrial structure subsystem. If , it indicates that subsystem promotes subsystem . If , it indicates that subsystem and subsystem have no interaction. If , subsystem could inhibit subsystem .
The parameters can be estimated by the least squares method. Least squares estimation meets , among them:
3.2 Correlation Analysis
Grey relational analysis is generally divided into 5 steps: 1) Establish the evaluation matrix; 2) Determine the reference sequence and comparison sequence; 3) Conduct dimensionless processing of data; 4) Calculate the grey correlation coefficient; and 5) calculate the comprehensive grey relational degree and arrange the relational order. Based on relevant data on the economic development and industrial structure of the Beijing-Tianjin-Hebei region, this paper constructs three core indicators: Rationalization, elevation and ecology of the regional industrial structure. Adopting the grey dynamic correlation analysis method, the three core indicators are coupled with the economic growth rate to comprehensively estimate the three indicators of industrial structure in the Beijing-Tianjin-Hebei region.
3.2.1 Establish Evaluation Matrix
evaluated objects and evaluation indicators are set to form the set of evaluated objects and evaluation indicators . The corresponding value of the evaluation object is denoted as , and the evaluation matrix is formed as:
In this paper, three indicators (shown in Table 1) are selected to optimize the industrial structure in the Beijing-Tianjin-Hebei region: Rationalization of the industrial organization, sophistication of the industrial structure and ecologicalization of the industrial structure. Each index is decomposed, and the Theil index, proportion of primary industry, proportion of secondary industry, proportion of tertiary industry, contribution rate of GDP of secondary industry, contribution rate of GDP of tertiary industry, and ratio of energy consumption to GDP are selected as detailed indexes to measure rationalization, sophistication and ecologicalization of the industrial structure.
Table 1 Industrial structure optimization index system of Beijing-Tianjin-Hebei region |
| Industrial structure optimization index evaluation system | Sophistication of industrial structure | GDP contribution rate of secondary industry; GDP contribution rate of tertiary industry |
| Rationalization of industrial structure | Ratio of energy consumption to GDP |
| Ecologicalization of industrial structure | Theil index; Proportion of output value of the three industries |
3.2.2 Determine the Comparison Sequence and the Reference Sequence
Comparative sequence refers to the data sequence composed of factors that affect the behavior of the system. It is constructed with the value of the evaluation index of each evaluated object. In this paper, 1985 data are selected as the comparative series. The reference sequence is constructed by selecting the optimal value from each value of the evaluation index
[16- 19]. When the evaluated index is positive, the larger the value is, the better it is. In this case, the optimal index is the maximum value of each index. When the evaluated index is the reverse index, the smaller the value is, the better it is. In this case, the optimal index is the minimum value of each index. When the evaluated index is a moderate index, the closer its value is to a fixed value, the better it is; at this time, the optimal index value is this fixed value.
According to the above selection criteria, we can determine the reference sequence, that is, the optimal index set:
where represents the optimal index set and represents the optimal value of the -th index.
3.2.3 Dimensionless Processing
In the evaluation index system of industrial structure, there are differences in the meaning, content and value standard of each index, which leads to different dimensions of data and is not convenient for unified comparison. Therefore, to make the data comparable, in the application of the grey correlation method, dimensionless processing of data is generally required to eliminate the effective factors of each index so that it can be converted into dimensionless data of standardized order of magnitude under the unified measurement scale to facilitate the comparative analysis of each index
[20, 21].
The common methods of dimensionless processing mainly include the normalized transformation method, indexation transformation method, segmented grading transformation method, etc. The most commonly used is the normalized transformation method. This paper also chooses this method to conduct dimensionless processing on the evaluation
[22, 23] index data of the Beijing-Tianjin-Hebei industrial structure. Among the 7 indicators selected in this paper, there are both positive and reverse indicators.
Positive indicators:
Reversibility index:
where represents the original data of the -th index of the -th year, represents the normalized value of the corresponding index, is the maximum value of the original data, and is the minimum value of the original data.
3.2.4 Calculate the Grey Correlation Coefficient
The grey correlation coefficient is the manifestation of relevance in grey theory. Relevance essentially refers to the degree of difference between the geometric shapes of the curves. Therefore, the magnitude of the difference between the curves can be used as a measure of the degree of association. In the grey correlation analysis method, the correlation coefficient is the geometric distance between the reference sequence and the comparison sequence at each time point. The larger its value is, the greater the degree of correlation between the two index sequences on the corresponding index is. Let the correlation coefficient be , and its calculation formula is as follows:
where is constant and . Under normal circumstances, takes 0.5. This paper also takes 0.5.
3.2.5 Calculate the Comprehensive Grey Relational Degree, and Arrange the Relational Order
Because the correlation coefficient is the correlation degree between the reference sequence and the comparison sequence, and it is also the correlation degree at different time points, there is more than one correlation coefficient, and the correlation coefficient is scattered, so it cannot be uniformly compared. The grey correlation degree is the value obtained by pooling these correlation coefficients and certain methods, which can generally reflect the correlation degree of the industrial structure optimization index series in this paper. The greater the grey correlation degree is, the more optimized the industrial structure of the economy will be.
According to the value of the grey correlation degree, the order of the grey correlation degree is the order of the merits of the industrial structure of the Beijing-Tianjin-Hebei region in this paper. The greater the grey correlation degree is, the more optimized the industrial structure of the economy corresponding to the index sequence will be; otherwise, the weaker it will be. The calculation formula of the comprehensive grey relational degree is as follows:
3.3 Comprehensive Evaluation Analysis
The optimization and upgrading of industrial structure is complex and comprehensive. A single conventional evaluation method cannot accurately evaluate the optimization and upgrading of industrial structure. In this section, the three core indicators are coupled with the economic growth rate to comprehensively estimate the optimization and upgrading of the industrial structure in the Beijing-Tianjin-Hebei region. The coupling degree itself is a physical concept, which is often extended to the study of multiple systems. Coupling refers to the phenomenon in which multiple systems or motion modes affect each other and even combine through various interactions. It is a dynamic relation of mutual dependence and promotion. Industrialization, urbanization and agricultural modernization promote social and economic development, and the three systems interact with each other. Therefore, this study uses the coupling degree calculation model to measure the degree of closeness between the three systems:
where is the coupling degree. When , the system is in an unrelated state or among factors within the system, and the system is in a state of disordered development. With the increase of the value, the system is in an ideal state of development.
4 Construction of the "Three Modernizations (Sophistication, Rationalization and Ecologicalization)" Measurement Model of the Beijing-Tianjin-Hebei Industrial Structure
Optimization of the regional industrial structure includes its rationalization, sophistication and ecologicalization according to the convention. However, most of the current methods for estimating the rationalization and sophistication of industrial structure do not consider its ecologicalization. According to the development goal of "accelerating the reform of ecological civilization system" proposed in the report of the 19th National Congress of the Communist Party of China in 2017, estimation of regional industrial structure optimization should adopt new indicators that can reflect ecological development, which has strong theoretical reference value and practical urgency. In addition to the rationalization and sophistication of regional industrial structure, this paper comprehensively considers its ecologicalization and lists the ecologicalization indexes separately. After the three core indicators are listed separately, considering the coupling between the three indicators and economic growth, a three-dimensional graph is used to estimate the comprehensive index of regional industrial structure optimization through the dynamic evolution among the three core indicators and to identify the trend and rule of the optimization and adjustment of regional industrial structure.
Due to the rich literature on regional industrial structure optimization, when a regional industrial structure is optimized, a basic model is typically not adopted. The similarity, distance and standard structure criteria are also seldom used. Because countries' development circumstances differ, the standard of one country may not be applicable to another, at least not directly. In recent years, it has become more common to use certain indicators to compare estimation methods within a country. Existing estimation methods mainly fall into two categories. One is direct estimation, in which a certain index is used to directly estimate the whole of regional industrial structure optimization, which is mostly used to measure the structural optimization of an industry, such as manufacturing. The other category is using multiple indicators to directly measure multiple aspects, mainly including optimization of output value structure, optimization of trade structure, balance of industrial structure, and ecological change in industrial structure, generally adopting at least three indicators. Using a single index to measure the level of industrial structure optimization of an entire region is obviously inadequate, as it cannot reflect the region's full situation. The use of multiple indicators is too complex. Even if different weights are assigned to each indicator, there are still many problems in the allocation of weights, and it is difficult to systematically reflect the full picture of regional industrial structure optimization. The second category involves estimating the rationalization and sophistication of industrial structure to jointly measure the level of regional industrial structure optimization. This type of method is consistent with the analysis of the full picture of the above regional industrial structure optimization and is more accurate, systematic and comprehensive. The single index is used to measure the rationalization and sophistication of regional industrial structure, which is simple and clear in form and has strong operability. At present, it has become the main estimation method. Among the available indexes, calculation of rationalization of regional industrial structure most often uses the redefined Theil index by GanChunhui or moderately improves upon it. There are many measurement indicators for the sophistication of regional industrial structure, with most considered from the perspective of the relative proportion of tertiary industry. The three indicators of rationalization, Sophistication and ecologicalization used together to calculate the level of regional industrial structure optimization, more in line with the connotation of regional industrial structure optimization. The rationalization of the regional industrial structure is represented by , the sophistication of the regional industrial structure is represented by , and the ecologicalization of the regional industrial structure is represented by . Guided by GanChunhui, we use the redefined Theil index to calculate the rationalization of the regional industrial structure:
where is the initial value of the rationalization of regional industrial structure, represents an industry, represents the output value of industry, represents the total output value of the region, and represents the size of the labor force in the region. This index uses the quality of aggregation of different industries in the region to measure the rationalization level of the industrial structure, which reflects not only the degree of coordination between regional industries but also the effective utilization of regional resources and the quality of coupling between the structure of factor input and output. Moreover, this estimation method has strong practical operability and practicability. Since is an inverse indicator, make it positive:
In previous studies, some scholars adopted the reciprocal positive processing method, which led to the change of the distribution rule of the original index and the deviation of the evaluation result. The forward treatment method of Equation (15) can effectively avoid the disadvantages of the direct reciprocal forward treatment method. After the positive transformation, it is more intuitive to observe the change of . The larger the value is, the more reasonable the industrial structure is. Conversely, the lower the value is, the more unreasonable the industrial structure is.
When measuring the sophistication of regional industrial structure, previous scholars mainly took Clark's law as the basis and measured the output value of regional non-agricultural industries. In recent years, due to the extensive application of information technology in secondary and tertiary industries and the rise of producer services, the output ratio of non-agricultural industries is no longer sufficient to measure the sophistication level of regional industrial structure. Considering the authority of the indicator measurement method and availability of data at the same time, this paper focuses on the importance of tertiary industry in the regional economic structure and measures the sophistication of the industrial structure by the ratio of the contribution rate of tertiary and secondary industry to GDP.
This paper improves the existing method for estimating the ecologicalization of regional industrial structure. The index calculation method reflects low-pollution and low-energy consumption industries' contribution to the national economy. The main idea of the method is that because the current industrial sector is the main source of resource consumption and environmental pollution, and given the importance of the industrial sector in national economic development, 39 industrial sectors are selected as the evaluation object. Low-pollution industries are those with lower emission intensity in these industrial sectors, measured by the top 19 of the 39 industrial sectors. For the convenience of statistics, this paper chooses the sectors with more serious pollution and higher emission proportions. Low-energy industries are the 19 industrial sectors with lower energy intensity. This type of measurement method is relatively detailed, but the actual resource consumption and environmental pollution come not only from the industrial sector but also from other sectors including agriculture, catering, and transportation. It is not enough to measure the ecologicalization of the industrial structure of the entire region only by the ecological environment of the industrial sector. Moreover, the industrial pollutants in this method are only the main pollutants, which is not sufficiently comprehensive. In addition, the first 19 industrial sectors with low environmental pollution and energy consumption are used to evaluate pollution and energy consumption, which is somewhat subjective. If industrial pollution and energy consumption are relatively serious, even the first nine industrial sectors still have high levels of both. The "three high" in energy conservation and emission reduction refers to high pollution, high energy consumption and high emissions. Reducing energy consumption is also important for China's industrial structure to become ecological. Therefore, ecologicalization can be considered from the perspective of energy consumption. China's industrial energy consumption is too high. Reducing energy consumption is more important than other aspects and is in fact the primary task. China has huge space to reduce energy consumption. In addition, reducing energy consumption requires cleaner production technology, and the corresponding environmental pollution level will be reduced. Therefore, reducing energy consumption can be regarded as the core and basic problem of regional industrial structure ecology. In this paper, the ratio of the total energy consumption of six energy-intensive industries to GDP is used to measure the state of the ecological environment, which is a reverse indicator. The regional industrial structure ecologicalization is obtained by positive treatment.
4.1 Selected Data Sequence
The data source of this paper emphasizes availability and comparability, and this paper collates the original data of the Beijing-Tianjin-Hebei region as the research object. Data from 1985–2016 are adopted, and the data are from the China Statistical Yearbook (1985–2017) and China Urban Statistical Yearbook (1985–2017).
4.2 Dimensionless Processing
In this paper, the evaluation index data of the Beijing-Tianjin-Hebei industrial structure are processed dimensionless by normalizing transformation method. Formulas (10) and (11) are used to address the positive and reverse indicators among the 7 selected indicators.
There are many methods to calculate the weight of the index. This paper uses the entropy method, which can reflect the utility value of index information entropy and avoid the interference of subjective consciousness.
Because each industry in the region is in different but interactive subsystems, the total contribution to the order degree of each order parameter in the subsystem can be realized by the integrated method using the geometric average method and linear weighted sum method.
5 Measurement Analysis of the Beijing-Tianjin-Hebei Industrial Structure
Based on the above analysis, this paper uses the regional data of the Beijing-Tianjin-Hebei region to estimate the three levels of regional industrialization and uses the grey dynamic correlation analysis method to couple the three core indicators with the economic growth rate to comprehensively estimate the indicators of regional industrial structure optimization.
5.1 Measurement Analysis of the "Three Modernizations" of the Industrial Structure
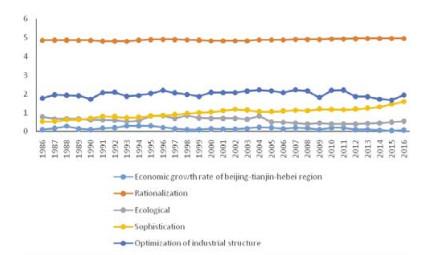
Industrial structure rationalization of the Beijing-Tianjin-Hebei region as a whole is increasing, growing from 1.86 in 1986 to 1.96 in 2016. However, the trend is not obvious, showing only slight improvement, and it also reflects the reality: The specialized division of labor between the main city of the Beijing-Tianjin-Hebei region is based on differences among all the major cities in terms of resources and comparative advantages, but due to the low-level repetitive construction and malignant competition and convergence of industrial structure, regional industrial structure optimization and upgrading must be improved.
Figure 1 Trend chart of industrial structure optimization in the Beijing-Tianjin-Hebei region |
Full size|PPT slide
According to the data in the table, the overall ecologicalization of industrial structure in the Beijing-Tianjin-Hebei region is not high and presents the characteristics of high in the middle and low at both ends. As the core region of the Bohai rim region and northeast Asia, economic growth in the Beijing-Tianjin-Hebei region is heavily dependent on a large amount of energy consumption, and especially the consumption of coal with high proportions of waste water, waste gas, waste residue and carbon dioxide emissions. At the same time, the ecological levels of the industrial structures in Beijing, Tianjin and Hebei are not balanced: Beijing is better than Tianjin, Tianjin is better than Hebei, and the ecological level of Hebei's industrial structure is far behind those of Beijing and Tianjin, which is ultimately slowing the evolution of the overall ecologicalization of the industrial structure in Beijing, Tianjin and Hebei. The overall sophistication of the industrial structure of the Beijing-Tianjin-Hebei region is and has been operating at a relatively high level. From the perspective of the evolutionary trend, the sophistication of the industrial structure shows a steady upward trend, which reflects the rapid development of tertiary industry in the Beijing-Tianjin-Hebei region. Compared with secondary industry, tertiary industry plays an increasingly prominent role in the economic structure and continues to improve. From the specific data, the peak reached 2.21 in 2007 and then declined slowly to 1.81 in 2009. This is mainly due to the impact of the financial crisis in 2008, which caused the Beijing-Tianjin-Hebei regional industrial structure to experience a temporary decline. Among the three, the ecological industrial structure has a great influence on the elevation of the industrial structure, while the rationalization of the industrial structure has a relatively small influence.
5.2 Measurement Analysis of the "Three Modernizations" of the Industrial Structure
First, the rationalization, sophistication and ecologicalization of China's regional industrial structure are taken as three axes, and a three-dimensional diagram is drawn according to the estimated results in Table 2 (Figure 2).
Table 2 Estimated value of industrial structure optimization in the Beijing-Tianjin-Hebei region |
| | Economic growth rate of Beijing-Tianjin-Hebei region | Rationalization | Ecological level | Sophistication | Optimization of industrial structure |
| 1986 | 0.1 | 4.86 | 0.79 | 0.53 | 1.77 |
| 1987 | 0.17 | 4.87 | 0.67 | 0.54 | 1.95 |
| 1988 | 0.28 | 4.87 | 0.69 | 0.62 | 1.93 |
| 1989 | 0.14 | 4.85 | 0.68 | 0.62 | 1.9 |
| 1990 | 0.09 | 4.86 | 0.63 | 0.7 | 1.72 |
| 1991 | 0.18 | 4.82 | 0.63 | 0.8 | 2.07 |
| 1992 | 0.19 | 4.82 | 0.6 | 0.79 | 2.09 |
| 1993 | 0.3 | 4.81 | 0.54 | 0.73 | 1.88 |
| 1994 | 0.3 | 4.87 | 0.57 | 0.76 | 1.92 |
| 1995 | 0.3 | 4.9 | 0.83 | 0.82 | 2.03 |
| 1996 | 0.21 | 4.91 | 0.84 | 0.85 | 2.19 |
| 1997 | 0.15 | 4.9 | 0.7 | 0.89 | 2.05 |
| 1998 | 0.1 | 4.89 | 0.86 | 0.96 | 1.97 |
| 1999 | 0.09 | 4.87 | 0.73 | 1.01 | 1.87 |
| 2000 | 0.14 | 4.84 | 0.7 | 1.03 | 2.08 |
| 2001 | 0.13 | 4.84 | 0.7 | 1.11 | 2.07 |
| 2002 | 0.12 | 4.84 | 0.7 | 1.18 | 2.07 |
| 2003 | 0.16 | 4.84 | 0.65 | 1.14 | 2.15 |
| 2004 | 0.22 | 4.88 | 0.83 | 1.06 | 2.21 |
| 2005 | 0.19 | 4.88 | 0.51 | 1.05 | 2.17 |
| 2006 | 0.15 | 4.88 | 0.49 | 1.09 | 2.07 |
| 2007 | 0.19 | 4.91 | 0.46 | 1.13 | 2.21 |
| 2008 | 0.18 | 4.91 | 0.41 | 1.11 | 2.17 |
| 2009 | 0.09 | 4.92 | 0.45 | 1.19 | 1.81 |
| 2010 | 0.19 | 4.93 | 0.41 | 1.17 | 2.19 |
| 2011 | 0.19 | 4.93 | 0.4 | 1.15 | 2.2 |
| 2012 | 0.1 | 4.95 | 0.41 | 1.19 | 1.86 |
| 2013 | 0.09 | 4.96 | 0.43 | 1.24 | 1.85 |
| 2014 | 0.06 | 4.96 | 0.46 | 1.3 | 1.71 |
| 2015 | 0.04 | 4.96 | 0.51 | 1.46 | 1.67 |
| 2016 | 0.07 | 4.96 | 0.55 | 1.58 | 1.94 |
Figure 2 Three-dimensional industrial structure optimization of the Beijing-Tianjin-Hebei region |
Full size|PPT slide
To comprehensively evaluate and analyze the changes in China's regional industrial structure optimization, the curve in Figure 2 is the trajectory of the center of gravity of three indicators, indicating the size of the role of each indicator. It is seen that the center of gravity first leans toward the rationalization and ecologicalization of the regional industrial structure, indicating that the role of these two indicators has been increasing. The extent of the backward inclination to the sophistication of the regional industrial structure is obviously increased, which indicates that tertiary industry plays a significant role in the optimization of the regional industrial structure. After 1992, the role of regional industrial structure rationalization weakens, the role of regional industrial structure sophistication strengthens, and the final trend line is close to sophistication.
As is widely known, optimization of regional industrial structure is bound to promote sustainable economic growth, and there is a very close relationship between optimization of regional industrial structure and economic growth. Since there are many indexes of regional industrial structure optimization, the grey dynamic correlation analysis method can be adopted to estimate the coupling relationships among the three core indexes of regional industrial structure optimization and economic growth to obtain the influence of the three core indexes on economic growth. The grey dynamic correlation analysis method is a typical multifactor statistical analysis method. Based on the sample data of each index, the grey correlation degree is used to reflect the sizes of the coupling relationships among the indexes. If the change trend between the reflected indicators is more consistent, the correlation degree is larger. Otherwise, the correlation degree is smaller. This method can be used to conduct quantitative analysis of the development trend of the dynamic process, analyze the influence degree of each factor on the result, and solve the comprehensive evaluation problems that change with time and can greatly reduce the loss caused by information asymmetry and is suitable for the dynamic process analysis of time series. According to the grey dynamic correlation analysis method, the average correlation coefficients of , and to economic growth are 0.79, 0.89 and 0.96, respectively. Among them, economic growth is expressed as the year-on-year growth rate of GDP. The larger the value of the system is, the greater its average influence on economic growth is. Therefore, the ecologicalization of industrial structure has the greatest influence on economic growth, followed by sophistication, and rationalization has the weakest influence. This paper estimates the comprehensive optimization index of regional industrial structure , which is expressed as:
where, and respectively represent the correlation coefficients between and and economic growth. After calculation, the results are shown in Table 2. The overall situation is increasing, indicating that the industrial structure of the Beijing-Tianjin-Hebei region has been continuously optimized and the development quality has steadily improved.
6 Conclusion
Based on constructing the optimization index of the Beijing-Tianjin-Hebei industrial structure, this paper uses the grey relational analysis method to combine the rationalization, sophistication and ecologicalization of the industrial structure with the economic growth rate and comprehensively calculates the comprehensive index of the industrial structure in the Beijing-Tianjin-Hebei region. The following conclusions are drawn: 1) Rationalization of the industrial structure in the Beijing-Tianjin-Hebei region shows an overall upward trend but one that is not obvious. There are obvious resource differences, vicious competition and convergence of industrial structures among cities. The overall ecologicalization of the industrial structure in the Beijing-Tianjin-Hebei region is general, with high in the middle, low at both ends, and uneven in distribution. The overall sophistication of the industrial structure of the Beijing-Tianjin-Hebei region is relatively high and has been operating at a high level, reflecting that tertiary industry occupies a prominent position in the economic structure. 2) By the method of grey correlation analysis of dynamics, this paper compares the rationalization of industrial structure, ecologicalization and sophistication in the process of economic growth. We can see that the ecologicalization of the industrial structure has the greatest influence on economic growth, followed by the sophistication of the industrial structure and empirically the influence of the rationalization of industrial structure on economic growth is relatively weak.
Based on the above conclusions, the following countermeasures and suggestions are put forward. The government should accelerate the transformation and upgrading of secondary industry in the Beijing-Tianjin-Hebei region, adhere to the concept of green industry and environmental protection, and promote the innovative development of industry. The convergence of industrial institutions in Hebei and Tianjin should be paid special attention, and the macrostrategy should be adjusted to give full play to the advantages of each region and prevent the market from tilting. Second, we should give full play to the resource advantages of Beijing, Tianjin and Hebei to improve the industrial division of labor. Beijing should pay more attention to production, learning and research; Make use of university resources and research institutes; Vigorously develop the modern service industry and actively promote technological innovation. Tianjin should rely on manufacturing industry and port logistics advantages to build a high-level modern manufacturing base. Hebei should actively promote supply-side structural reform, control environmental pollution and accelerate the progress of industrial informatization. Finally, the integration of Beijing, Tianjin and Hebei should follow the objective law of economic development to achieve a win-win situation of complementary advantages.
{{custom_sec.title}}
{{custom_sec.title}}
{{custom_sec.content}}
 PDF(217 KB)

 Table 1 Industrial structure optimization index system of Beijing-Tianjin-Hebei region
 Figure 1 Trend chart of industrial structure optimization in the Beijing-Tianjin-Hebei region


