Evaluation of Heavy Commercial Vehicles Brand Considering Multi-Attribute Indexes in China

Xiaoqin XIONG, Aiguo CHENG

Journal of Systems Science and Information ›› 2020, Vol. 8 ›› Issue (4) : 291-308.

PDF(330 KB)
PDF(330 KB)
Journal of Systems Science and Information ›› 2020, Vol. 8 ›› Issue (4) : 291-308. DOI: 10.21078/JSSI-2020-291-18
 

Evaluation of Heavy Commercial Vehicles Brand Considering Multi-Attribute Indexes in China

Author information +
History +

Abstract

Assessment of brand competitiveness which influences consumer trends and company's sales performance contributes to business development. This paper elaborates the theories and the main investigations of brand competitiveness, and formulates a comprehensive hierarchical structure integrating multi-attribute indexes, i.e., social, technical, managerial, environmental and cultural criteria. An integrated multi-criterion decision-making (MCDM) model combining with analytic hierarchy process (AHP), grey relational analysis (GRA) and VIKOR is presented to determine the weights of influence criteria and to evaluate brand competitiveness. The utilized integrated methodology has been proved to be valid and practical by the empirical application on three enterprises. The results provide an accurate and effective tool for MCDM problem and also a new guideline for the enterprise development.

Key words

heavy commercial vehicles / brand competitiveness / multi-criterion decision-making (MCDM) / grey relational analysis (GRA) / VIKOR

Cite this article

Download Citations
Xiaoqin XIONG , Aiguo CHENG. Evaluation of Heavy Commercial Vehicles Brand Considering Multi-Attribute Indexes in China. Journal of Systems Science and Information, 2020, 8(4): 291-308 https://doi.org/10.21078/JSSI-2020-291-18

1 Introduction

In recent decades, China's economy has been growing, which leads to the increasing national and household disposable income and demand for private cars. China's auto industry has made great progress. It has steadily occupied the first place in the world for eight years since 2009[1-3]. Within the thriving industry, there is always an intense competition among automakers to attract the attention of the public[4]. In the face of the unprecedented outbreak of China's car market, the major automakers are strengthening their brand strategies and campaigns to improve their services by upgrading product technology and accelerating new development models to improve service quality. Automobile companies are setting up a good brand image to attract the attention of consumers and seize the market share[5].
Brand value is very important to automobile enterprises. It can bring many realistic benefits such as getting a premium, being helpful to extend the production line, gaining more market share, and so on. Automobile giants have adjusted their brand development strategies, implemented brand marketing as the key strategy of the company, and strived to improve their market share with good brand image and brand power[6]. Based on the above, the way to enhance the company's brand competitiveness is an essential part to get it into the world's largest vehicle market.
Advanced technologies such as self-driving and new energy cars may have great influences on consumers to make a choice among vehicle brands as well as the desire to own a car, and also create potential opportunities and challenges which will present to automotive and non-automotive brand managers and researchers[7]. Moreover, self-brand personality differences will have a certain impact on consumer's attitudes towards car brands[8]. The result of that would be the brand-name competitiveness reflecting the incremental value added to a commercial car by its brand identity[9]. Prestige brands not only earn brand-name premia but also seize high-margin market segments. The global branding strategy of motor manufacturers has made a positive impact on their performance[10]. Domestic brands are becoming more and more popular especially in China. These brands are developing and expanding rapidly in the largest car market by almost double speed. Besides, corresponding development strategies and industrial objectives have also been formulated for all brands[11].
The research is devoted to explore the evaluation of commercial vehicles brand competitiveness theories, and to formulate a comprehensive hierarchical structure that integrates impact criteria, i.e., market property, environmental property, communication property, technical property, cultural property. First, we conclude and summarize the theory and practice experience of commercial vehicle brand competitiveness through complex phenomena, and establish a simple and clear knowledge model. Second, the results of this study can optimize scientific and other related aspects of the future brand management and decision-making of commercial vehicle production enterprises in a certain extent of the guidance. With it, enterprises find out their own strengths and weaknesses easily, and potential customers are attracted by their more competitive products and services. It is also of a practical value.
The remainder of this paper is organized as follows. Section 2 proposes the hybrid MCDM method. Section 3 details the method and explores its empirical application in three enterprises. Section 4 analyzes and discusses the results of the previous chapter. The last section shows the conclusions.

2 Solution Methodology

An integrated MCDM approach combining AHP and G-VIKOR is proposed to evaluate the heavy commercial vehicles brand competitiveness considering multi-attribute indexes in China. The calculation procedure of this approach can be summarized in two stages, as described by the detailed flowchart shown in Figure 1. AHP is applied to analyze the influences and interrelationships among each criterion, and to obtain the final weights of each criterion. The optimal alternative will be evaluated via G-VIKOR. Besides, a novel hierarchical structure of criteria for evaluation is proposed. The specific procedures and processes of both phases are summarized in the following sub-sections.
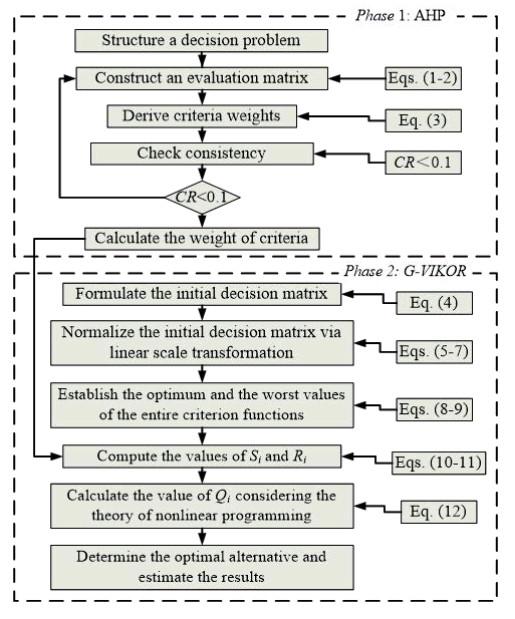
Figure 1 The flowchart of the proposed novel hybrid approach

Full size|PPT slide

2.1 Hierarchical Criteria for Evaluation

To formulate the comprehensive hierarchical structure of criteria for the evaluation of commercial vehicles brand competitiveness in China, we reviewed the existing literature and interviewed experienced experts from colleges/enterprises. Thus, the structure is built as tabulated in Table 1. The structure includes two levels, i.e., attribute and sub-criterion. The attribute level involves market property (A1), environmental property (A2), brand property (A3), technological property (A4) and cultural property (A5). Market property includes market share (M1), market penetration (M2), sales (M3), profit margin (M4), and profit rate (M5). Environmental property includes economic conditions (E1), political and legal environment (E2) and competitive environment (E3). Brand property includes brand positioning (B1), brand communication (B2), brand awareness (B3), brand reputation (B4), brand loyalty (B5) and brand association (B6). Technological property includes investment of R & D (T1), technical developers (T2), success rate of R & D (T3), output value of new products (T4) and number of patents (T5). Cultural property includes enterprise culture construction (C1) and culture forces (C2). Besides, the descriptions of each sub-criteria are shown in Table 1.
Table 1 The hierarchical structure of the commercial vehicles brand in criteria & sub-criteria
Attribute No. Sub-criteria No. Description Ref.
Market property A1 Market share M1 Referring to the proportion of an enterprise's sales in the same product market. [1217]
Market penetration M2 The extent to which a product is recognized and bought by customers in a particular market.
Sales M3 Referring to its sale quantity.
Profit margin M4 The amount by which revenue from sales exceeds costs in a business.
Profit rate M5 The relative profitability of an investment project.
Environ-mental property A2 Economic conditions E1 The economy state in a country or region. [1820]
Political and legal environment E2 Government actions that affect the operations of a company or business.
Competitive environment E3 The dynamic external system in which a business competes and functions.
Brand property A3 Brand positioning B1 An activity of creating a brand that occupies a distinctive place and value in the target customer's mind. [2126]
Brand communication B2 The combination of activities that influences customers' view of a company and its products.
Brand awareness B3 The level of consumer consciousness of a brand.
Brand reputation B4 Referring to how a particular brand is viewed by others.
Brand loyalty B5 Positive feelings towards a brand and dedication to purchase the same product or service repeatedly now and in the future from the same brand, regardless of a competitor's actions or changes in the environment.
Brand association B6 Brand association is a connection formed in a buyer's mind with the brand.
Technolo-gical property A4 Investment of R & D T1 Innovative activities undertaken by corporations in developing new services or products, or improving existing services or products. [2731]
Technical developers T2 The number of technical developers.
Success rate of R & D T3 The percent of new products that introduced to the market and that succeed to meet commercial objectives of the business unit who launched the products.
Output value of new products T4 The ratio of the new-product's output value to the total output value.
Patents T5 The number of patents.
Cultural property A5 Enterprise culture construction C1 Its profound meaning is to condense and activate human capital, cultivate core competence, enhance the brand image, and improve the efficiency of management system. [3233]
Culture forces C2 The influencing mechanisms that exist within a society guide business practices and purchasing behavior.

2.2 AHP Approach

AHP, introduced by Saaty[34], reveals the principle to obtain the relative importance of several clusters of criteria to lay the foundation for MCDM problems. A hierarchical structure, including different levels and various criteria, formulated based on the characteristics of certain events, could be categorized into three layers, i.e., the target one, the rule one, and the index one[35]. The pair-wise comparison matrix (PWCM) was structured by related experts with reliable experience based on the fundamental scale of comparison values as shown in Table 2, thus calculating the corresponding weight of each decision criterion in the hierarchical structure[36]. Additionally, the analysis procedure not only considers subjective preferences but also integrates expert experience with objective information to ensure the rationality and effectiveness. The basic steps could be summarized into five parts: a) Identify the decision problem; b) Formulate the fundamental scale about preferences among criteria; c) Structure a PWCM A for k decision criteria by related experts as shown in Equations (1) and (2); d) Obtain the weights vector of each criterion w=(w1,w2,,wk) in the hierarchical structure, according to Equation (3); e) Check consistency based on the final consistency ratio (CR) where CR=(λmaxk)/(RI(k1))[37, 38]. Note that CI is the consistency indicator and RI the random consistency indicator as shown in Table 3
A=[aij],i=1,2,,k;  j=1,2,,k,
(1)
aii=1,  aij>0,  aji=1/aij,i=1,2,,k;  j=1,2,,k,
(2)
Aw=λmaxw,
(3)
Table 2 AHP scale for combinations
Numerical scale Definition Explanation
1 Equal importance Two activities contribute equally to the objective.
3 Moderate importance Experience and judgment slightly favor one over another.
5 Strong importance Experience and judgment strongly favor one over another.
7 Very strong importance An activity is strongly favored and its dominance is demonstrated in practice.
9 Absolute importance Importance of one over another affirmed on the highest possible order.
2, 4, 6, and 8 Intermediate values Used to represent compromise between the priorities listed above.
Reciprocals (1/aij) A value attributed when activity i is compared to activity j becomes the reciprocal when j is compared to i
Table 3 Random consistency index (RI)
k 1 2 3 4 5 6 7 8 9 10
RI 0 0 0.58 0.9 1.12 1.24 1.32 1.41 1.45 1.49
where w expresses the eigenvector corresponding to the maximal eigenvalue λmax of matrix A.
If CR<0.1, the judgment matrix can be accepted. Otherwise, it is unable to meet the requirements of consistency, which should be reviewed and improved.

2.3 G-VIKOR Approach

The compromise ranking method, i.e., VIKOR, presented by Opricovic[39] is normally employed to solve the complex MCDM problems of obtaining the optimal alternative against conflicting decision criteria. The method depends on an aggregating function inspired by the Lp-metric. Lp-metric reflects the distance to the positive/negative ideal individuals, and determines the ultimate ranking of each alternative on the basis of the compromise between the maximum "group benefit" and the minimum "individual regret"[40]. Because VIKOR has high computational efficiency and a simpler mathematical form to measure the relative performance for alternatives, it has been widely used in many fields, e.g., material selection[41-44]. To further strengthen the accuracy and validity of this approach, we involved GRA into the conventional aggregating function to better identify relationships among each alternative. The calculation procedures of this approach are summarized in the following.
Step 1 Formulate the initial decision matrix. Assuming that Ai (i=1,2,,n) represents the i th optimal solution, and Bj (j=1,2,,m) represents the j th evaluation criterion in the MCDM problem, the initial decision matrix X can be expressed concisely in a matrix format as follows:
X=B1BjBmA1AiAn[x11xi1xn1x1jxijxnjx1mximxnm],
(4)
where xij indicates the optimization value of each optimal solution/alternative Ai (i=1,2,,n) with respect to each criterion Bj (j=1,2,,m).
Step 2 Normalize the initial decision matrix via linear scale transformation. Note that Z represents the normalized decision matrix as follows:
Z=[zij]n×m,
(5)
zij=xijmaxixij,i=1,2,,n;  j=1,2,,m.
(6)
Step 3 Establish the optimum fi and the worst fi values of the entire criterion functions as follows:
fj={max1in({zij}i=1n)|jJ+,min1in({zij}i=1n|jJ},
(7)
fj={min1in({zij}i=1n)|jJ+,max1in({zij}i=1n|jJ},
(8)
where J+ expresses the parameter set which the greater the better, and J expresses the parameter set which the smaller the better.
Step 4 Compute the values of Si and Ri (i=1,2,,n) combining the grey correlation coefficient between the ith solution and negative/positive-ideal solution regarding the jth object on the basis of GRA.
Si=j=1mwj(miniminj|fjzij|+ρmaximaxj|fjzij||fjzij|+ρmaximaxj|fjzij|),j,
(9)
Ri=maxj[wj(miniminj|fjzij|+ρmaximaxj|fjzij||fjzij|+ρmaximaxj|fjzij|)],j,
(10)
where wj (j=1,2,,m) represents the weight of jth object that can be obtained using the AHP approach. In addition, ρ[0,1] represents the resolution criterion. In this section, ρ is set to 0.5[43].
Step 5 Calculate the value of Qi (i=1,2,,n) using the relation.
{mini=1n[(Qiμi)2+(Qiηi)2]μi=(SiS)/(SS),ηi=(RiR)/(RR),s.t.min(μi,ηi)Qimax(μi,ηi),0<Qi<1,
(11)
and then,
S=maxSi,S=minSi,R=maxRi,R=minRi.
Step 6 Judging criteria as follow:
C1: QjQj1/(j1), where, Qj and Qj are the best and second alternative, respectively. j is the number of alternatives.
C2: Sort the first solution Sj (or Rj) in Qj value must sort than the second at the same time.

3 Verification of the Empirical Case

An empirical application on three enterprises proves that this utilized integrated methodology is valid and practical. The sub-sections, entitled "Background and Review", discusses the weighting of each criterion by AHP approach and the evaluation processes by G-VIKOR.

3.1 Background and Review

3.1.1 Overview of D' long Series of Heavy Commercial Vehicles (Alternative 1)

Shaanxi Automobile Group Co., Ltd began to develop since 1968, producing and selling all kinds of truck, engine and automobile components. Cooperating with foreign ventures, this company has developed an excellent research and development (R & D) system and technologies that reaches the international or domestic advanced level. D' long series of heavy commercial vehicles are high-class trucks which can completely replace the corresponding imported products. The vehicles, designed by German MAN company, symbolize the technical cooperation between China and German. Also, their excellent quality wins public praise.

3.1.2 Overview of Dongfeng Tianlong Series of Heavy Commercial Vehicles (Alternative 2)

The Second Automobile Works, established in 1969, is the predecessor of Dongfeng commercial vehicles Co., Ltd. Since 1975, it started producing heavy commercial vehicles and gained goodwill for high-quality: Low oil consumption, high dynamic performance, good durability and extra security. Dongfeng Tianlong series of heavy commercial vehicles have world leading technologies and processing skills. They are targeted to domestic markets and different users. International cooperation maximizes the power of technical fusion, and upgrades performance of the system performance, especially in its technology, safety, economy, reliability, comfort and other aspects of independent innovation.

3.1.3 Overview of Hualing Heavy Commercial Vehicles (Alternative 3)

Hualing Xingma Automobile Group Co., Ltd. is an important invention industrial base of heavy truck and related core components in China. It produces and sells a wide variety of products including complete vehicles, power trains, axles, heavy special trucks, buses and other components. Their special motor vehicles play a leading role in domestic market, and have also been exported for years. Meanwhile, the industrial-academic-research cooperation has a strong technical force of production and new product development capability. With over forty years of achievement, Hualing has developed a unique culture in the future global competition.
Based on the selected model of the configuration parameters as close as possible principle, the body, weight, output power, maximum horsepower and other parameters of each model are taken into account, and the following three models are selected. Table 4 describes the related configuration parameters.
Table 4 The related configuration parameters of each alternative
Alternative 1 Alternative 2 Alternative 3
Automobile Brand Shaanxi Automobile Group Co., Ltd Dongfeng commercial Vehicles Co., Ltd Hualing Xingma Automobile Group Co., Ltd
Type SX4256NT324Z DFL4251AX16A HN4250G37CLM3
Drive form 6*4 6*4 6*4
Wheelbase 3175+1400 mm 3300+1350 mm 3200+1350 mm
Vehicle body (length*width*Height) 6.68 m*2.49 m*4.0 m 6.96 m*2.5 m*3.7 m 6.87 m*2.495 m*3.8 m
Front tread 2036 mm 2040 mm 2065 mm
Rear track 1800/1800 mm 1820/1820 mm 1860/1860 mm
Vehicle weight 8.8 t 8.8 t 8.7 t
Total mass 25.0 t 25.0 t 25.0 t
Traction of the total mass 40.0 t 40.0 t 40.0 t
Maximum speed 99.0 km/h 98.0 km/h 90.0 km/h
Number of cylinders 6 6 6
Fuel type Diesel Diesel Diesel
Displacement 11.596 L 11.12 L 11.596 L
Maximum output power 276.0 kW 283.0 kW 276.0 kW
Torque 1800 Nm 1800 Nm 1800 Nm
Maximum horsepower 375 BHP 385 BHP 375 BHP
Rated speed 1900 rpm 1900 rpm 1900 rpm
Maximum torque speed 10001400 rpm 11001500 rpm 1800 rpm
Quasi passenger number 3 3 3
Seating rows Row half Row half Row half
Shift mode Manual Manual Manual
Gearbox Fast 12JSD180 T Fast 12JSD180 TA Fast 12JSD160 T
Forward gear 12 12 12
Reverse the number 2 2 2
Tire number 10 10 10
Fuel tank / gas cylinder material Aluminum alloy Aluminum alloy Iron.
Fuel tank capacity 400.0 L 400.0 L 350.0 L
Suspension type Leaf spring Leaf spring Leaf spring
Rear axle allowable load 18000 kg 18000 kg 18000 kg

3.2 Weighting of Each Criterion by AHP Approach

The pair-wise comparison matrixes of each attribute in the hierarchical structure was structured by related experts with reliable experience as shown in Table 5, based on the fundamental scale of comparison values demonstrated in Table 2. In the same way, the matrixes from market property (A1-M), environmental property (A2-E), technological property (A3-T), management property (A4-F) and cultural property (A5-C) are presented in Tables 610, respectively.
Table 5 TPair-wise comparison matrix from each attribute
A1 A2 A3 A4 A5
A1 1 6 1/3 1/5 4
A2 1/6 1 1/5 1/9 1
A3 3 5 1 1/4 6
A4 5 9 4 1 8
A5 1/4 1 1/6 1/8 1
Table 6 air-wise comparison matrix from market point of view (A1-M)
M1 M2 M3 M4 M5
M1 1 5 2 3 3
M2 1/5 1 1/4 1/3 1/4
M3 1/2 4 1 3 1
M4 1/3 3 1/3 1 1/3
M5 1/3 5 1 3 1
Table 7 Pair-wise comparison matrix from environmental point of view (A2-E)
E1 E2 E3
E1 1 4 6
E2 1/4 1 3
E3 1/6 1/3 1
Table 8 Pair-wise comparison matrix from communication point of view (A3-T)
B1 B2 B3 B4 B5 B6
B1 1 4 3 1/3 1/3 4
B2 1/4 1 1/3 1/6 1/5 1
B3 1/3 3 1 1/4 1/3 3
B4 3 6 4 1 1 6
B5 3 5 3 1 1 5
B6 1/4 1 1/3 1/6 1/5 1
Table 9 Pair-wise comparison matrix from technological point of view (A4-F)
T1 T2 T3 T4 T5
T1 1 4 2 3 3
T2 1/4 1 1/3 1 1/2
T3 1/2 3 1 2 2
T4 1/3 1 1/2 1 1
T5 1/3 2 1/2 1 1
Table 10 Pair-wise comparison matrix from cultural point of view (A5-C)
C1 C2
C1 1 1/3
C2 3 1
Based on the calculation process of AHP, the weights vector of each criterion in the hierarchical structure and the value of CR can be computed. The importance of each criterion, CR of each material, and the ultimate weights vector of criteria on overall goal of evaluation index can be obtained, which is presented in Table 11.
Table 11 Criteria weight and rank on overall goal
Attribute Weight Criteria Weight Final weight Rank
Market property 0.1512 Market share 0.3929 0.0594 7
Market penetration 0.0543 0.0082 20
Sales 0.2242 0.0338 10
Profit margin 0.1073 0.0162 15
Profit rate 0.2212 0.0334 12
Environmental property 0.0428 Economic conditions 0.6853 0.0293 13
Political and legal environment 0.2213 0.0095 19
Competitive environment 0.0934 0.0040 21
Brand property 0.2339 Brand positioning 0.1680 0.0393 9
Brand communication 0.0471 0.0110 17
Brand awareness 0.1038 0.0243 14
Brand reputation 0.3325 0.0778 3
Brand loyalty 0.3015 0.0705 5
Brand association 0.0471 0.0110 17
Technological property 0.5270 Investment of R & D 0.4028 0.2123 1
Technical developers 0.0926 0.0488 8
Success rate of R & D 0.2454 0.1293 2
Output value of new products 0.1205 0.0635 6
Patents 0.1387 0.0731 4
Cultural property 0.0451 Enterprise culture construction 0.2500 0.0113 16
Culture forces 0.7500 0.0338 10

3.3 Evaluation Processes by G-VIKOR

Initial data and related information can be gathered by experts from various fields, e.g., scholars of college and supervisors of enterprise, through questionnaire surveys. In this research, three experts, including two scholars and a supervisor, were interviewed to obtain the pair-wise comparison matrix of each criterion and the decision matrix for the score of three enterprises. Due to space limitation, the final matrixes are only given as Table 12. The investigation was conducted in June, 2017.
Table 12 The score of each criterion for commercial vehicles brand competitiveness of three enterprises
Alternative 1 Alternative 2 Alternative 3
Market share 4.67 8.33 1.67
Market penetration 3.67 8.33 1.33
Sales 5.33 6.67 2.67
Profit margin 4.00 3.67 3.33
Profit rate 1.33 3.33 3.67
Economic conditions 2.67 5.00 5.00
Political and legal environment 5.00 4.67 3.33
Competitive environment 5.67 5.33 3.67
Brand positioning 4.33 7.33 6.33
Brand communication 5.00 5.33 5.33
Brand awareness 5.33 3.67 2.00
Brand reputation 5.00 6.67 8.67
Brand loyalty 4.67 5.33 4.00
Brand association 1.33 3.67 1.33
Investment of R & D 5.33 7.33 3.33
Technical developers 4.33 6.00 4.67
Success rate of R & D 5.33 3.67 4.33
Output value of new products 2.67 4.67 3.33
Patents 5.33 5.67 3.33
Enterprise culture construction 7.67 4.33 6.00
Culture forces 4.67 6.67 5.33
The score of each criterion for commercial vehicles brand competitiveness of three enterprises is listed in Table 12. The final rank of the value Qi can be obtained via the calculation process of this hybrid approach, i.e., G-VIKOR. Thereby, the optimal alternative is selected based on the results. The concrete procedure for the assessment of empirical example, i.e., three enterprises, is shown below:
The initial decision matrix X can be obtained by Table 12. Note that xii indicates the value of each alternative Ai (i=1,2,3) with respect to each evaluation criterion Bj (j=1,2,,21). Then, the normalized decision matrix can be calculated by Equations (5)(6). The criteria in this hierarchical structure of commercial vehicles brand are benefit elements. The optimum and the worst values of the entire criterion functions can be obtained according to Equations (7)(8). The values of Si and Ri (i=1,2,3) can be calculated by Equations (9)(10). Finally, the final rank of each alternative shown in Table 13 can be obtained by the values of Qi (i=1,2,3), which are calculated by Equation (11).
Table 13 The values of Si and Ri
Alternative 1 Alternative 2 Alternative 3
Si 0.5031 0.5749 0.8519
Ri 0.2123 0.0995 0.1293
Based on the calculation process, the overall closeness index for D'long series of heavy commercial vehicles is 0.5000, the overall closeness index for Dongfeng Tianlong series of heavy commercial vehicles is 0.8971, and the overall closeness index for Hualing heavy commercial vehicles is 0.3678, i.e., alternative 2 alternative 1 alternative 3.

4 Analysis and Discussion

4.1 Comparison and Validation

In this work, AHP-TOPSIS method[42] and AHP-GRA method[44] are applied to compare the outcomes of the integrated approach. Note that the same weight is adopted when using three MCDM approaches. Table 14 expresses the assessment results obtained from three decision approaches.
Table 14 Comparison results obtained from three approaches
Alternatives AHP-TOPSIS method The proposed method AHP-GRA method
Value Order Value Order Value Order
1 0.4537 2 0.5000 2 0.4841 2
2 0.5749 1 0.8971 1 0.7522 1
3 0.4263 3 0.3678 3 0.2515 3
From Table 14, it can be seen that the results of three methods are consistent and close basically. This shows that the integrated method is reasonable and feasible to evaluate commercial vehicles brand competitiveness in China. However, this approach combines the advantages of GRA and VIKOR to make the evaluation process more objective and realistic.

4.2 Discussion

Brand competitiveness is the core of an enterprise in the commercial vehicle market. Enhancing brand competitiveness offers a company advantages among its competitors, for example, leading it to be a guide and supporting role in the whole industries structure.
The key to enhance brand competitiveness is to make an objective and accurate evaluation and research of brand's comprehensive strength. The evaluation is based on the objectivity and operability of the proposed methods. This section validates the results of the commercial vehicle brand image background analysis in China obtained by the literature and interviewed feedback from different experts.
With the rapid development of economy and society, the competition ability of enterprises depends on high quality products. High quality commercial vehicles would not only increase economic benefits, but also set a good corporate image and show the company's social responsibility. It is the advanced technologies that enable manufacturer to produce high-quality autos. Therefore, the competitive power crucially depends on an enterprise's control of new products and technologies, meanwhile, the competitiveness is determined by the innovative capacity for new products, which comes from the research and development of people[15]. Chen, et al. considered that Chinese car companies should put more fund, manpower and resource on R & D, independent innovation and personnel training to form an independent innovation platform, develop new products, improve the R & D management system and strengthen the protection of intellectual property for auto company[28]. Han, et al. presented that technology improvement associated with battery cost reduction has maintained cost competitiveness and played an essential role in the starting up China's BEPV market[45]. They offered identical views with the proposed results of factor analysis.
In the complex and volatile market, the competition of vehicle is either directly or indirectly linked with brand image and brand communication. Cretu and Brodie indicated that the brand's image has a more specific influence on the customers' perceptions of products and service quality, while the company's reputation has a broader influence on perceptions of customer value and customer loyalty[46]. Dorcak, et al. tested the relationships among factors by a careful statistics, in order to identify and describe the basic facts that affect company reputation of companies in a hyper competitive market. Analysis conducted on the selected parts of the global market identifies the findings. It can be used in any market for the purpose of increasing competitiveness of entities selected from the automotive industry[22].
Enterprise culture is the soul and spiritual support for the enterprise development, which provides strong spiritual motive and intellectual support. Jiang, et al. presented that managers should improve the level of talent management and development, fully exert the role of enterprises culture in HRM and increase talents' core competitiveness in enterprises[32]. The market and environment factors in China will inevitably influence China's enterprises competitive situation where there appears to be of a rapid changing dynamic of trends. Li, et al. pointed out that there has a strong correlativity between competitiveness of regional equipment manufacturing and economic strength. Various regions should adjust measures based on local conditions and take effective measures to improve competitiveness of equipment manufacturing[19].

5 Conclusion

In China's vehicle industry, evaluating commercial vehicles brand competitiveness is proved to be a tough challenge. This paper elaborates the theories and the main investigations/studies of brand competitiveness. It formulates a comprehensive hierarchical structure that integrates impact criteria, i.e., social, technical, managerial, environmental and cultural criteria. A novel MCDM model that combines AHP, GRA and VIKOR is presented to determine weights of influence criteria and to evaluate the brand competitiveness of enterprises. Three commercial vehicles brand in China, i.e., D'long series of heavy commercial vehicles, Dongfeng Tianlong series of heavy commercial vehicles and Hualing heavy commercial vehicles, are carried out. The results show that Dongfeng Tianlong series of heavy commercial vehicles have the optimal brand competitiveness in China. In future work, we will add environmental property in the hierarchical structure of commercial vehicles brand. In addition, fuzzy theory will be integrated in the evaluation process.

References

1
Jing H, Lin J Y, Jing P. Using grey relational analysis with entropy to predict the international financial center of China. Journal of Systems Science and Information, 2017, 5 (1): 88- 96.
2
Xiao Y J, Zhang D X. The command decision method of multiple UUV cooperative task assignment based on contract net protocol. Journal of Systems Science and Information, 2016, 4 (4): 379- 390.
3
Liu Z W, Hao H, Zhao F Q. Current situation, development demand and future trend of automotive technologies in China. Automobile Technology, 2017, (1): 1- 6.
4
Liu J. Investigation into logistics outsourcing supplier selection for automobile manufacturers. 9th International Conference on Management Science and Engineering Management (ICMSEM), Advances in Intelligent Systems and Computing, 2015, 362, 1239- 1248.
5
Jo H J, Jeong J H. The governance of the automotive product development organization: A focus of a company's pilot center. Korean Journal of Sociology, 2015, 49 (4): 37.
6
Wagner S M, Silveira-Camargos V. Managing risks in just-in-sequence supply networks: Exploratory evidence from automakers. IEEE Transactions on Engineering Management, 2012, 59 (1): 52- 64.
7
Olson E L. Will songs be written about autonomous cars? The implications of self-driving vehicle technology on consumer brand equity and relationship. International Journal of Technology Marketing, 2017, 12 (1): 23.
8
Moons I, Pelsmacker P D. Self-brand personality differences and attitudes towards electric cars. Sustainability, 2015, 7 (9): 12322- 12339.
9
Baltas G, Saridakis C. Brand-name effects, segment differences, and product characteristics: An integrated model of the car market. Journal of Product & Brand Management, 2009, 18 (2): 143- 151.
10
Choi M, Lee Y, Koo K R, et al. A case study of Hyundai motors: Live brilliant campaign for modern premium brand. Asia Marketing Journal, 2015, 16 (4): 75- 87.
11
Wang X S, Fan X H. Analysis and evaluation of the development strategy of China's family cars industrial independent brands. Proceedings of 2010 International Conference on Industry Engineering and Management, Changzhou, 2010: 49-54.
12
Urban G L, Carter T, Gaskin S, et al. Market share rewards to pioneering brands: An empirical analysis and strategic implications. Management Science, 1986, 32 (6): 645- 659.
13
Zufryden F S. A composite heterogeneous model of brand choice and purchase timing behavior. Management Science, 1977, 24 (2): 121- 136.
14
Tsafarakis S, Grigoroudis E, Matsatsinis N. Consumer choice behaviour and new product development: An integrated market simulation approach. Journal of the Operational Research Society, 2011, 62 (7): 1253- 1267.
15
Kim B. Dynamic effects of learning capabilities and profit structures on the innovation competition. Optimal Control Applications & Methods, 2015, 20 (3): 127- 144.
16
Huang J T, Chen Y Q. A study on synthetic fuzzy measurement model of marketing competitiveness. 2008 International Seminar on Business and Information Management, Wuhan, 2008, 2, 873- 876.
17
Li G. New perspective upon enterprise competitiveness: Competition among enterprises in the product and element markets. China Industrial Economy, 2007, 28 (1): 61- 67.
18
Thanasuta K, Patoomsuwan T, Chaimahawong V, et al. Brand and country of origin valuations of automobiles. Asia Pacific Journal of Marketing & Logistics, 2009, 21 (3): 355- 375.
19
Li R P, Cui H D, Cui Z. The evaluation and analysis of competitiveness in regional equipment manufacturing based on factor analysis. IEEE International Conference on Machine Learning and Cybernetics, 2011: 1031-1036.
20
Wang L F, Wen W, Lai M Y, et al. Measurement of the automobile industrial security degree in China. IEEE International Conference on Management Science & Engineering 17th Annual Conference, 2010: 205-211.
21
Zhang H, Yao L, Liu N. Research on Chinese self-owned auto brand building on the basis of the valuechain theory. Proceedings of 4th International Conference on Software Technology and Engineering (ICSTE 2012), Phuket, ASME Press, 2012. https://doi.org/10.1115/1.860151.
22
Dorcak P, Markovic P, Pollak F. Multifactor analysis of online reputation of selected car brands. Procedia Engineering, 2017, 192, 719- 724.
23
Huang Y C, Yang C, Huang M H. The research on the growth concept of independent intellectual property famous brand. IEEE International Conference on Information Management, Innovation Management and Industrial Engineering, 2010: 314-317.
24
Ewing M T, Windisch L, Newton F J. Corporate reputation in the people's republic of China: A B2B perspective. Industrial Marketing Management, 2010, 39 (5): 728- 736.
25
Zheng X, Ye M A. A study on vehicle dealers competitiveness evaluation matrix based on capability and loyalty. Automotive Engineering, 2009, 31 (1): 94- 99.
26
Yao J, Chen J H, Liu Z B. The modeling identification design of rubbish vehicle based on brand culture. Packaging Engineering, 2014, 35 (8): 39- 42.
27
Davis B A, Figliozzi M A. A methodology to evaluate the competitiveness of electric delivery trucks. Transportation Research Part E: Logistics & Transportation Review, 2013, 49 (1): 8- 23.
28
Chen H, Yang Y, Chen L. Analysis and strategy of intellectual property rights innovation of self-brand car in China. IEEE International Conference on Future Information Technology and Management Engineering, 2010: 97-100.
29
Zhou G L. Supporting China private enterprise development by technological innovation. Proceedings of Zhengzhou Conference on Management of Technology (MOT 2009), Zhengzhou, 2009, 1, 166- 170.
30
Li X J, Xie N X, Xu K. Study on technological competitiveness of China-owned brand automotive enterprises. China Soft Science, 2009, 45 (5): 125- 134.
31
Meng D H, Li X J, Xu K. Differences of technology absorptive capacity: Evidence from China's automotive industry. Science & Technology Progress & Policy, 2014, 31 (19): 81- 86.
32
Jiang M, Shen Q, Mu Y. To exert the role of enterprises culture, to achieve effective human resources management. IEEE International Conference on Management and Service Science, 2011: 1-3.
33
Ataei V, Sharifirad M S. Organizational culture and innovation culture: Exploring the relationships between constructs. Leadership & Organization Development Journal, 2012, 33 (5): 543- 544.
34
Saaty T L. How to make a decision: The analytic hierarchy process. Interfaces, 1994, (24): 19- 43.
35
Tian G D, Chu J W, Hu H S, et al. Technology innovation system and its integrated structure for automotive components remanufacturing industry development in China. Journal of Cleaner Production, 2014, 85, 419- 432.
36
Dagdeviren M, Yavuz S, Kilinc N. Weapon selection using the AHP and TOPSIS methods under fuzzy environment. Expert Systems with Applications, 2009, 36, 8143- 8151.
37
Kannan M, Jepsen M B. ELECTRE: A comprehensive literature review on methodologies and applications. European Journal of Operational Research, 2016, 250 (1): 1- 29.
38
Kannan M, Diabat A, Shankar S M. Analyzing the drivers of green manufacturing with fuzzy approach. Journal of Cleaner Production, 2015, 96, 182- 193.
39
Opricovic S, Tzeng G H. Compromise solution by MCDM methods: A comparative analysis of VIKOR and TOPSIS. European Journal of Operational Research, 2004, 156 (2): 445- 455.
40
Zhang N, Wei G. Extension of VIKOR method for decision making problem based on hesitant fuzzy set. Applied Mathematical Modelling, 2013, 37 (7): 4938- 4947.
41
Li N N, Zhao H R. Performance evaluation of eco-industrial thermal power plants by using fuzzy GRAVIKOR and combination weighting techniques. Journal of Cleaner Production, 2016, 135, 169- 183.
42
Tian G D, Zhang H H, Feng Y X, et al. Green decoration materials selection under interior environment characteristics: A grey-correlation based hybrid MCDM method. Renewable & Sustainable Energy Reviews, 2018, 81, 682- 692.
43
Tian G D, Zhang H H, Feng Y X, et al. Operation patterns analysis of automotive components remanufacturing industry development in China. Journal of Cleaner Production, 2017, 164, 1363- 1375.
44
Zhang H H, Peng Y, Tian G D, et al. Green material selection for sustainability: A hybrid MCDM approach. PloS One, 2017, 12 (5): e0177578.
45
Han H, Ou X M, Du J Y, et al. China's electric vehicle subsidy scheme: Rationale and impacts. Energy Policy, 2014, 73, 722- 732.
46
Cretu A E, Brodie R J. The influence of brand image and company reputation where manufacturers market to small firms: A customer value perspective. Industrial Marketing Management, 2007, 36 (2): 230- 240.
PDF(330 KB)

242

Accesses

0

Citation

Detail

Sections
Recommended

/