What is the Industrial Structure Changes of China?

Yijie WANG, Yanyan KE, Xianrui MA, Yitian REN

Journal of Systems Science and Information ›› 2020, Vol. 8 ›› Issue (6) : 487-503.

PDF(7136 KB)
PDF(7136 KB)
Journal of Systems Science and Information ›› 2020, Vol. 8 ›› Issue (6) : 487-503. DOI: 10.21078/JSSI-2020-487-17
 

What is the Industrial Structure Changes of China?

Author information +
History +

Abstract

Although China has made great achievements in economic scale, the model of high-quality economic developments is still in the exploratory stage. A series problems, such as unreasonable industrial structure and low production efficiency, need to be resolved urgently. The transformation and upgrading of industrial structure is the inevitable choice. The analysis of industrial relations is an important method to reveal the internal mechanism of industrial structure change. Therefore, based on the concepts of sensitivity and influence coefficient, this paper proposed the concepts of driven and driving coefficient, and constructed the industrial complex networks of China from 1999 to 2013 according to the EORA input-output table. From the perspectives of the interaction power, industrial linkages and community structure, this paper systematically analyzes the evolution of China's industrial structure. Results show that China's industrial structure is undergoing a transformation from industry-oriented to industry-service-oriented. The interaction linkages between industries has formed a robust association structure. The traditional sectors such as infrastructure construction and industries are still the largest consumer group driving the development of other industries. Besides, light industry, infrastructure construction and finance have become increasingly important hub industries in the industrial system. However, some unbalanced community structures are formed in the economic system, which has resulted in a waste of resources and low production efficiency to a certain extent. Effectively grasping the relationship between China's industrial structure evolution and its association is conducive to formulating economic restructuring policies, promoting the upgrading of China's economic and, realizing the leap from quantitative change to qualitative change.

Key words

industrial structure / driven and driving ability / complex network / community structure

Cite this article

Download Citations
Yijie WANG , Yanyan KE , Xianrui MA , Yitian REN. What is the Industrial Structure Changes of China?. Journal of Systems Science and Information, 2020, 8(6): 487-503 https://doi.org/10.21078/JSSI-2020-487-17

1 Introduction

The industrial development of China has significant influence on the global economic system. As one of the most important economic power, China's economic scale has always been at the forefront of the world[1]. The gross domestic product (GDP) has increased from 360 billion RMB in 1978[2] to 74.36 trillion1 RMB in 2018, which increased by 225 times. However, a series of problems resulted from the economic growth are becoming more and more prominent. Environmental pollution, low productivity, inefficiency of resource utilization and so on[3] have seriously restricted the sustainable development of China's economy. Transition of economy from high-speed growth to medium-high-speed growth, from fast-scale growth to high-quality growth is the key target of China's 13th Five-Year Plan[4]. Industrial restructuring has become the key to the improvement of China's economic quality, such as supply-side structural reform. Although the industrial structure of China has been improved continuously, there are still some structural problems that need to be resolved.
The lacking of diversification for the constitution of primary industry, serious environment pollution of heavy industry[5], insufficient development of light industry[6], the overweight of primary service industry with low added value[7] and the urgent strengthen for the modern service industry[8] need determination to be addressed. Industrial structure is the foundation of national economic development, many scholars have studied the industrial structure from three perspectives: 1) The relationship between industrial structure and economic growth[9], the structure changes resulted from the inter-industrial sectors technological differences[10, 11] and the evolution of China's industrial structure[12] have been studied. 2) More and more scholars pay attention to how the industrial structure affect the carbon emissions[13], energy conservation and urbanization[14]. 3) What and how the influencing factors affect the industrial structure[1518].
However, previous literatures applied the industrial structure as an indicator or factor to different studies. The output ratio of primary, secondary and tertiary industries is the most commonly used indicator. Few studies have been found to make a thorough study on the industrial structure changes. In fact, the relationship between the industrial sectors is complex which includes direct and indirect linkages[19]. Although the industrial linkages and the situation of regional industrial clusters were explored by means of the MFA method[20, 21], interrelated structures and key industrial sectors have not been mentioned in these studies. Some studies focused on China's industrial relevance and the influence[22], linkages and interactions of China's construction industry on other industrial sectors[23]. The evolution of industrial structure is a systematic issue which involves the relationships, interactions, and the influences among various industrial sectors. Although previous studies have made certain efforts and achieved some significant progress, few studies have been found, which conducted in-depth discussions on the evolution of the industrial structure from the perspectives of all the 123 industrial sectors of China. Meanwhile, China's economy and industry developed rapidly from 1999 to 2013, and also experienced ups and downs at the same time. Therefore, how the changes of China's industrial structure from 1999 to 2013 can provide reference for the government's policy-making.
To comprehensively analyze the industrial structure changes of China, the total consumption coefficient and the total distribution coefficient were employed to reveal the influencing power of 123 industrial sectors from 1999 to 2013. On the basis of these two coefficients, the driven coefficient and the driving coefficient are used to reflect the overall influence of the industrial sectors on the entire industrial network. The driven and driving networks are constructed by using the total consumption coefficient and the total distribution coefficient to reveal the critical position of the industrial sectors in the network. Compared with previous studies, the total consumption and total distribution coefficients can reflect the total impacts of direct and indirect relationships between industrial sectors.

2 Methodology and Data Source

2.1 The Framework of the Methodology

To reveal the characteristics of industrial structure changes from the perspective of driven and driving ability, the input-output analysis (IOA) and social network analysis (SNA) are adopted. The framework of the methodology used in this paper mainly includes three steps: 1) The definition of the structure characteristics of industries from the driven and driving perspective. In this paper, the driven and driving characteristics are discussed from two aspects: The characteristics of industry relative to other industries and of the entire industrial system. 2) The reflection of the driven and driving characteristics of industry. First, the driven and driving coefficients are established according to the total consumption and total distribution coefficient. Second, based on the driven and driving coefficients, the driven social network and driving social network are constructed. 3) The analysis of driven and driving characteristics from two aspects: Relative to other industries and in the entire industrial system. The driven and driving coefficient are used to represent the driven and driving capability for other industries. After that, the social network analysis method is used to reveal the characteristics of industry relative to the entire industrial system.

2.2 Driven and Driving Coefficient of Industry

2.2.1 The Total Consumption Coefficient and Driven Coefficient

The total consumption coefficient is an important concept in input-output analysis, which means that the unit output of a certain product consumes the quantity of other products, including the various indirect consumptions needed to produce such a product[24].
B=A+C.
(1)
In Formula (1), A is the direct consumption coefficient, and C is all indirect consumption coefficient. B is the total consumption coefficient[25].
B can be obtained as followed.
B=(IA)1I.
(2)
In Formula (2), I is the same order identity matrix. The total consumption coefficient reveals the direct and indirect relationships between industrial sectors, and more deeply reflects the internal interdependence between industrial sectors.
However, the total consumption coefficient cannot reflect the industry's driven influence on the entire industrial system. Here the driven coefficient is employed to reveal the driven influence on the whole industrial system. The driven coefficient is as followed.
Fj=1ni=1nbij1n2i=1nj=1nbij=i=1nbij1ni=1nj=1nbij,j=1,2,,n.
(3)
In Formula (3), bij is the total consumption coefficient of sector j to sector i, which represents the total increment of the total output value of each sector brought by the final product of sector j, also known as the backward linkage with other sectors. The larger the driven coefficient, the greater the driven influence on other industrial sectors. If the driven coefficient Fj>1, the driven impact of sector j exceeds the average level of entire industrial system.

2.2.2 Total Distribution Coefficient and Push Coefficient

The total distribution coefficient is symmetrical to the direct consumption coefficient. According to the symmetrical structure, the total distribution coefficient can be obtained:
D=(IR)1I.
(4)
In Formula (4), I is the same order identity matrix. R is the direct distribution coefficient. D is the total distribution coefficient. The total distribution coefficient reveals the direct and indirect linkages between sectors and more profoundly reflects the internal dependence between sectors. However, the total distribution coefficient cannot reveal the driving influence on the entire industrial system. Here the driving coefficient is employed to reflect the sector's impetus to the other sectors, also known as the forward linkage with other sectors[2628].
Fi=1nj=1nrij1n2i=1nj=1nrij=j=1nrij1ni=1nj=1nrij,i=1,2,,n.
(5)
In Formula (5), rij is the total distribution coefficient. Fi is the driving coefficient of industrial sector i. The larger the driving coefficient, the greater the driving influence on other sectors. If Fi>1, the driving impact of sector i exceeds the average level of the entire industrial system.

2.3 Complex Network Analysis

2.3.1 Construct of Complex Network

The driving complex networks and driven complex networks of China's industries were constructed by using 0-1 matrices which were dichotomized from the total distribution coefficient and total consumption coefficient. The averages of total consumption and total distribution coefficients were selected as the threshold. If the total consumption coefficients and total distribution coefficients are bigger than the threshold, the values are 1. Otherwise, the values are 0[29-31].

2.3.2 Industrial Network Density Analysis

The industrial network density can be used to describe the degree of node association in an industrial network. The relationship between nodes is tighter when the network density approaches 1, representing higher speed and efficiency of information and material flow in the network[32]. Network density formula is
D=Tn(n1).
(6)
In Formula (6), T is the number of all the connection lines in the network, n is the number of all nodes in the network. D is the complex network density.

2.3.3 Centrality Analysis of the Complex Network

Centrality is an important feature reflecting the significance of nodes in the complex network, which is consisted of the degree centrality and betweenness centrality. In this paper, the centrality reflects the industrial sector's influence from the perspective of quantitative. The degree centrality includes out-degree centrality and in-degree centrality, which mainly measures the number of edges connected to other nodes. The out-degree centrality of one node is the number of edges output from the node, and the in-degree centrality is the number of edges input the node. The out-degree centrality and the in-degree centrality represent producer and consumer in a complex industrial network respectively. The betweenness centrality is employed to reflect the node's control ability for its two adjacent nodes, which reveals the key-nexus industrial sector in the industrial complex network. The degree centrality and betweenness centrality are shown in Figure 1.
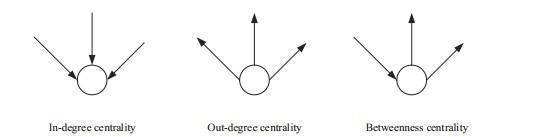
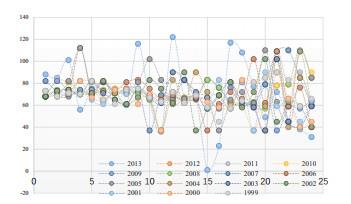
Figure 1 The degree centrality and betweenness centrality in complex network

Full size|PPT slide

2.3.4 Cohesive Subgroup Analysis of Complex Network

To explore the actual or potential relationships between different industrial sectors in a complex network, the cohesive subgroup analysis is employed. A cohesive subgroup is a subset of the entire set of actors in which the actors have a relatively strong, direct, tighter, or positive relationship with each other. The relationships of industrial sectors in different subsets are looser than those within a subset. By means of cohesive subgroup analysis, the structure of communities formed in a complex network and the equilibrium of the entire network can be measured.

2.4 Data Sources

In this paper, the EORA input-output table is used to calculate the total consumption coefficient and the total distribution coefficient of China's economic sectors. The EORA database provides the input-output table of the world's major countries since 1970. These IO tables have very detailed sectoral divisions, of which China IO Table contains 123 separate economic sectors[33, 34]. The relevant departments and their codes are shown in Appendix 1. The EORA database has two sets of input-output tables respectively based on the basic prices and purchased prices of the world's major countries. This paper selects China's basic price input-output table from 1999 to 2013, so as to avoid the impact of tax and commodity circulation profit and other factors, and conducts time series analysis of the relationship between various sectors.

3 Results

3.1 Driving and Driven Coefficients

The driving coefficient and driven coefficient of 123 industrial sectors of China are listed in Table 1. Given the research objective and space limitations, only the industrial sectors, of which the driving coefficient and driven coefficient ranked in the top ten from 1999 to 2013 are listed in this paper.
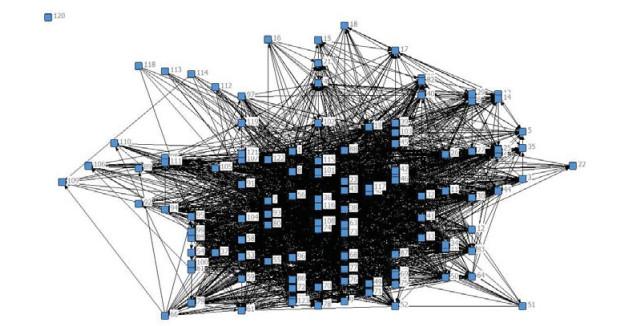
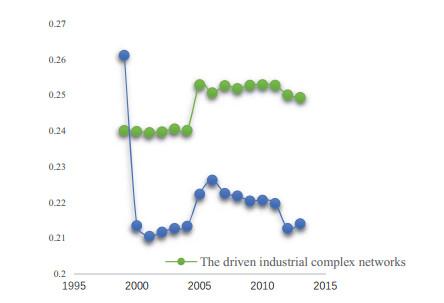
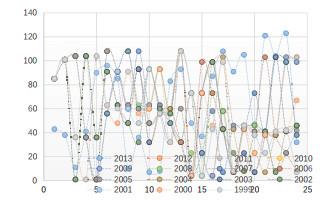
Table 1 The industrial sectors with top ten driving and driven coefficient
Year Driven coefficient Year Driving coefficient
2013 62, 67, 70, 71, 72, 73, 74, 77, 78, 81 2013 9, 10, 11, 12, 38, 39, 58, 59, 85, 123
2012 62, 67, 70, 71, 72, 73, 74, 77, 78, 81 2012 11, 37, 39, 69, 70, 91, 92, 94, 103, 106
2011 62, 67, 70, 71, 72, 73, 74, 77, 78, 81 2011 9, 10, 12, 38, 58, 59, 70, 85, 97, 103
2010 62, 67, 70, 71, 72, 73, 74, 77, 78, 81 2010 9, 10, 12, 38, 58, 59, 70, 85, 97, 103
2009 62, 67, 70, 71, 72, 73, 74, 77, 78, 81 2009 9, 10, 12, 38, 58, 59, 70, 85, 97, 103
2008 62, 67, 70, 71, 72, 73, 74, 77, 78, 81 2008 9, 10, 12, 38, 58, 59, 70, 85, 97, 103
2007 62, 67, 70, 71, 72, 73, 74, 77, 78, 81 2007 9, 10, 12, 38, 58, 59, 70, 85, 97, 103
2006 44, 45, 46, 49, 67, 70, 71, 74, 77, 84 2006 10, 12, 38, 44, 58, 59, 70, 85, 103, 123
2005 44, 45, 46, 49, 67, 70, 71, 74, 77, 84 2005 10, 12, 38, 44, 58, 59, 70, 85, 97, 103
2004 44, 45, 46, 49, 62, 67, 70, 71, 74, 77 2004 10, 12, 38, 44, 58, 59, 70, 85, 97, 103
2003 44, 45, 46, 49, 62, 67, 70, 71, 77, 84 2003 10, 12, 38, 44, 58, 59, 70, 85, 97, 103
2002 44, 45, 46, 49, 62, 67, 70, 71, 77, 84 2002 10, 12, 38, 44, 58, 59, 70, 85, 97, 103
2001 28, 42, 44, 45, 46, 49, 62, 70, 74, 77 2001 10, 12, 38, 44, 58, 59, 70, 85, 97, 103
2000 28, 42, 44, 45, 46, 49, 62, 67, 70, 74 2000 10, 12, 38, 44, 58, 59, 70, 85, 97, 103
1999 28, 42, 44, 45, 46, 49, 62, 67, 70, 77 1999 10, 12, 38, 44, 58, 59, 70, 85, 97, 103

3.1.1 The Driving Coefficient

From Table 1, the sectors with the top 10 driving coefficients from 1999 to 2001 mainly include wearing apparel, synthetic chemicals, chemical products for daily use, medical and pharmaceutical products, chemical fibers, cement and cement asbestos products, metalworking machinery, motor vehicles, other transport machinery, electronic element and device and communication equipment. From 2002 to 2006 they became chemical products for daily use, medical and pharmaceutical products, chemical fibers, cement and cement asbestos products, motor vehicles, other transport machinery, generators, communication equipment, electronic element and device, scrap and waste and metalworking machinery. After 2006, the driving coefficient in the top ten sectors are respectively metalworking machinery, motor vehicles, other transport machinery, generators, household electric appliances, other electric machinery and equipment, communication equipment, electronic element and device, electronic appliances, other electronic and communication equipment, cultural and office equipment.
It can be seen that the changes in the development of China's industries over time can be roughly divided into three stages: 1) From 1999 to 2002, wearing apparel, chemical products for daily use, medical and pharmaceutical products, cement and cement asbestos products, motor vehicles, other transport machinery, communication equipment were ranked in the top ten sectors. The driving coefficients of these industries are above 1.4, far exceeding the average of the total industrial sectors. 2) From 2002 to 2006, in the top ten industries, the driving ability of apparel manufacturing industry has significantly weakened. In contrast, the driving coefficient of the scrap and waste sectors has been significantly strengthen. 3) From 2007 to 2013, the driving ability of chemical products for daily use, medical and pharmaceutical products and chemical fibers have dropped out from the top ten sectors. By contrast, the driving ability of household electric appliances, other electric machinery and equipment, cultural and office equipment, arts and crafts products have been strengthen substantially. As can be seen from the changes of the three stages, the most driving ability of China's industries have experienced a shift from light industry to heavy industry, and then to the tertiary industries.

3.1.2 The Driven Coefficient

From the perspective of driven ability, it can be roughly divided into two stages from 1999 to 2013. 1) From 1999 to 2006, the top ten sectors are non-ferrous ore mining, non-metal minerals and other mining, raw chemical materials, chemical products for daily use, nonferrous metal smelting, nonferrous metal processing, other transport machinery, electricity and steam production, warehousing, eating and drinking places. 2) From 2007 to 2013, the top ten sectors have changed a little. Ferrous ore, non-ferrous ore mining, salt mining, raw chemical materials, chemical fertilizers, nonferrous metal smelting, nonferrous metal processing, other transport machinery, electricity and steam production, warehousing, eating and drinking places are raked in the top ten sectors.
From the results of the two stages, the driven ability of non-ferrous ore mining and chemical products for daily use have been weakened after 2006. By contrast, the driven ability of ferrous ore and warehousing has been enhanced. Besides, more than 60 sectors' driven coefficients are more than 1, exceeding the average of total 123 industrial sectors. Particularly, the sectors which have the most driven ability are mainly come from the manufacturing industry.

3.2 Complex Networks Analysis

3.2.1 The Industrial Complex Networks and Their Measuring Feasibility

Based on the 0-1 matrices derived from the total consumption matrix and total distribution matrix, Ucinet software is used to construct the driven complex networks and driving complex networks of 123 China's industrial sectors. With the help of Netdraw, the topology network have been drawn. Given the objective and space limitation, the complex network in 2013 is shown in Figure 2.
Figure 2 The topology network of China's industrial sectors

Full size|PPT slide

From the characteristics of driven and driving complex networks, it can be seen that the average path lengths are between 1.6 and 1.9 during 1999 and 2013, indicating that each industrial node in the network needs to pass 1.6 to 1.9 edges on average to reach another industrial node. The clustering coefficients of industrial complex networks in each year ranged from 0.5 to 0.7, reflecting that the actual number of connected edges between any industrial node accounts for 50% to 70% of the maximum possible connected edges. Therefore, industrial complex networks from 1999 to 2013 are typical small-world networks. That is, they have large clustering coefficients and small average path length[3538]. The measuring feasibility of driven and driving industrial complex networks have been verified.

3.2.2 Density of the Driven and Driving Industrial Complex Networks

The densities of driven and driving industrial complex networks are shown in Figure 3.
Figure 3 The densities of driven and driving industrial complex networks

Full size|PPT slide

From Figure 3, the densities of the driven industrial complex networks shows no evident fluctuations from 1999 to 2013. What is worth noting that the density in 2004 and 2005 have experienced a light change, which is from 0.24 to 0.25. By contrast, the densities of driving industrial complex networks have changed greatly from 1999 to 2013. 1) From 1999 to 2000, the density decreased from 0.26 to 0.21, which decreased by 18%. 2) From 2001 to 2004, the densities of driving industrial complex networks remains generally stable. 3) From 2005 to 2006, the densities increased dramatically and reached the maximum in 2006. 4) From 2006 to 2013, the densities have decreased from 0.2263 in 2006 to 0.2128 in 2012, which fallen by 5.9%.
The densities of the driven and driving industrial complex network reflect the industrial linkages between 123 industrial sectors. The higher the densities, the tighter the linkages between 123 industrial sectors. From Figure 3, it can be concluded that the industrial structure has improved continuously and the relationships of industrial sectors become closer.

3.2.3 Degree of Point Centrality Results

The degree of point-out and point-in reveals the driving ability and driven ability of the industrial sector, which affects other sectors and is affected by other sectors. This paper uses Ucinet6.0 to calculate the center of China's 123 departments, measuring the change of the center of 123 departments in China from 1999 to 2013. The results of the degree of point-in and point-out are shown in Figures 4 and 5 (Due to space limitations, this article only lists the top 25 sectors).
Figure 4 The top 25 sectors ranked by point-out

Full size|PPT slide

Figure 5 The top 25 sectors ranked by point-in

Full size|PPT slide

From Figures 4 and 5, the top 25 industrial sectors with the highest degree of point-out are electricity and steam production and supply, wholesale and retail trade, finance, crop cultivation, petroleum refining, highway freight and passengers transport, other general industrial machinery, business services. These sectors mainly come from agriculture, industry, services and construction industry, indicating that the industries driving economic development in China cover a wide range and involves the first, second and third industries. However, from the perspective of degree of point-in, the top 25 industrial sectors mainly includes construction, vehicles fittings production, other electric machinery and equipment, communication equipment, electronic computer, railroad transport equipment, ship building. These industrial sectors mainly come from the second industry, especially the infrastructure and construction industry. Therefore, it can be said that the economic development in China are taking the infrastructure and construction industry as the main driven force.

3.2.4 Betweenness Centrality Results

The results of betweenness centrality of 123 sectors from 1999 to 2013 were obtained by Ucinet 6.0. The results are shown in Table 2 (Due to space limitations, only the top 25 industries in 2013 are listed here).
Table 2 The top 25 sectors ranked by the betweenness centrality
Sector Betweenness nBetweenness Sector Betweenness nBetweenness
85 746.956 5.06 74 227.962 1.544
104 551.099 3.733 46 205.631 1.393
63 493.7 3.344 30 197.129 1.335
36 490.02 3.319 32 193.822 1.313
73 463.187 3.138 48 181.091 1.227
60 439.994 2.981 39 178.503 1.209
37 433.495 2.937 103 176.241 1.194
56 418.356 2.834 77 173.862 1.178
91 410.269 2.779 33 168.671 1.143
84 392.539 2.659 97 157.857 1.069
99 375.422 2.543 58 157.322 1.066
23 351.485 2.381 93 155.221 1.051
101 282.688 1.915
From Table 2, the industrial sectors of which the betweenness centrality are more than 2 includes electricity and steam production, finance, other general industrial machinery, petroleum refining, other electric machinery and equipment, metal products and coking. The sectors of which the betweenness centrality are between 1 and 2 includes wholesale and retail trade, communication equipment, chemical fibers, paper and products, chemical fertilizers and plastic products. These industrial sectors are mainly concentrated in the field of industry and infrastructure construction. These industries assume a bridge role in the economic system with strong resource control capabilities. It is noteworthy that the finance is only sector which come from the tertiary industry. From 1999 to 2013, the betweenness centrality of finance has been increasing continuously. Until 2013, the betweenness centrality of finance has been the second, which was only secondary to electricity and steam production. It shows that finance has become the key nexus sector in the economic system which promotes the resources and information circulation in the industrial sectors.

3.2.5 Cohesive Subgroup Results

A cohesive subgroup analysis was conducted for the 123 sectors from 1999 to 2013. 8 subgroups were obtained (see Figure 6). The densities of the subgroups in 2013 are listed in Table 3, showing that the relationships between industries are closer in higher-density subgroups.
Figure 6 Industrial symbiosis block division in China in 2013

Full size|PPT slide

Table 3 The density of Cohesion subgroup for 123 sectors in China in 2013
1 2 3 4 5 6 7 8
1 0.739 0.733 0.952 1 0.778 0.736 0.901 0.981
2 0.367 0.5 0.657 0.7 0.168 0.45 0.57 0.629
3 0.238 0.057 0.476 0.69 0.083 0 0.317 0.762
4 0.5 0.533 0.929 0.967 0.439 0.275 0.846 0.976
5 0.032 0.032 0.015 0.026 0.07 0.034 0.037 0.015
6 0.061 0.06 0.064 0.033 0.097 0.221 0.033 0.026
7 0.041 0.022 0.032 0.049 0.07 0.013 0.051 0.028
8 0.114 0.019 0.19 0.238 0.043 0.012 0.219 0.462
Table 3 shows that the density of the first subgroups, the second subgroups and the forth subgroup in 2013 are larger than those of the other subgroups. That is, the first subgroup, the second subgroup and the fourth subgroup are most closely related to other subgroups in China's industrial complex network in 2013. From 1999 to 2013, the subgroup and their densities are always changing, indicating that China's industrial symbiosis is not stable. Meanwhile, the subgroups with higher degree of point centrality and betweenness centrality have the higher subgroup densities.

4 Discussion

4.1 The Changes of Driving Ability of 123 Industrial Sectors

The driving coefficients of 123 industrial sectors from 1999 to 2013 are shown in Figure 7.
Figure 7 The changes of driving coefficient

Full size|PPT slide

From Figure 7, it can be seen that the driving coefficients of industrial sectors from 1999 to 2013 have not changed greatly. Besides, four notable salient values appeared: The non-ferrous ore mining sector in December 2012, the petroleum refining sector in December 2012, the raw chemical materials sector in December 2012, and the domestic public transport sector in December 2012. The driving coefficient of non-ferrous ore mining sector reached 10.7 in December 2012, which not only far exceeded the average of all sectors', but also exceeded the value in other years. The driving coefficients of petroleum refining sector and the raw chemical materials sector are 5.3 and 3.5, far exceeding the average of other sectors'. Besides, the driving coefficient of domestic public transport sector in December 2012 turned from positive to negative.

4.2 The Changes of Driven Ability of 123 Industrial Sectors

The driven coefficients of 123 industrial sectors from 1999 to 2013 are shown in Figure 8.
Figure 8 The changes of driven coefficients

Full size|PPT slide

From Figure 8, there are no obvious changes between the same sector's driven coefficients in different years. However, the driven coefficients of different sectors vary greatly. The driven coefficients of wearing apparel, synthetic chemicals, chemical products for daily use, medical and pharmaceutical products, chemical fibers, cement and cement asbestos products, metalworking machinery, motor vehicles, other transport machinery, electronic element and device, communication equipment, medical and pharmaceutical products, generators, , scrap and waste and metalworking machinery, were always in the first echelon from 1999 to 2013. The driven coefficients of these sectors have been generally stable but also some minor changes. Some high-tech sectors, services and cultural sectors began to replace some chemical and mineral sectors in the first echelon. The driven coefficients of electronic element and device, electronic appliances, other electronic and communication equipment, and cultural and office equipment are above 1.7, indicating that these sectors are important consumers in China's economic system.

4.3 The Industrial Sectors with Top Driving and Driven Ability

The industrial sectors of which the driving and driven coefficients are more than 1 are listed in Table 4.
Table 4 Sectors with a pull coefficient and a push coefficient greater than 1 between 1999 and 2013
Code Sector Code Sector
23 Cotton textiles 56 Steel-processing
33 Printing and record medium reproduction 57 Alloy iron smelting
36 Petroleum refining 58 Nonferrous metal smelting
37 Coking 59 Nonferrous metal processing
38 Raw chemical materials 63 Other general industrial machinery
41 Chemicals for painting, dying and others 68 Vehicles fittings production
42 Synthetic chemicals 69 Ship building
43 Chemicals for special usages 84 Scrap and waste
46 Chemical fibers 85 Electricity and steam production and supply
47 Rubber products 90 Railway freight transport
48 Plastic products
From Table 4, there are 21 sectors of which the driving and driven coefficients are more than 1 from 1999 to 2013, including chemical industry, petroleum processing, metal smelting and processing, energy, electricity, transportation and manufacturing and so on. These sectors play a key nexus role in the economic system. Their high-quality development can guide the development of related industrial sectors. They are the most important sectors which have a high degree of driving and driven capability to prompt the industries development. Besides, China's industrial structure has been constantly adjusted from 1999 to 2013. The leading role of manufacturing industry has gradually shifted to tertiary industries such as service businesses and cultural sectors. Meanwhile, manufacturing industry, energy industry and import and export trade have played an important role in promoting China's economy.

5 Conclusion

With the development of China's economy, the scale of the economy has undergone tremendous changes. However, many problems have also been exposed in the process of economic development. In order to achieve sustainable economic development, China is also carrying out economic restructuring. Industry is an organic whole with complicated relationships. The change of any one industry in this whole body will have a significant impact. Therefore, based on the EORA input-output table, this paper calculates the driven and driving coefficient between 1999 and 2013 in China and constructs the industrial complex network based on the complete coefficient matrix. Through the analysis of correlation coefficient and industrial complex network, finally obtained the change trend of China's economic industrial structure in 15 years and the deep-level mechanism of the inherent connection between industries. From the perspective of complex network, China's industries have formed extensive connections, and a robust interconnected structure, indicating that China's economy has moved from a single fragile structure toward a healthier direction. However, from the perspective of input-output, whether it is driven or driving, its main role is still infrastructure construction and traditional industries. This shows that China's economic and industrial structure still needs to be further optimized and upgraded to finally realize the leap from quantitative change to qualitative change. The theoretical framework proposed in this paper fully considers the complexity of the industrial structure and the dynamics of industrial structure changes, and makes up for the gap in industrial coverage and time span of existing research. However, due to the large number of industries involved, some of the results cannot be fully listed in the paper, and the analysis of individual industries is not in-depth enough, which needs to be further strengthened in future studies.

Appendix 1 EORA Input-Output Table Department and Code

Code Sector Code Sector
1 Crop cultivation 63 Other general industrial machinery
2 Forestry 64 Agriculture, forestry, animal husbandry and fishing machinery
3 Logging and transport of timber, bamboo 65 Other special industrial equipment
4 Livestock, its products 66 Railroad transport equipment
5 Fishery 67 Motor vehicles
6 Technical services for agriculture, forestry, livestock, fishing 68 Vehicles fittings production
7 Coal mining and processing 69 Ship building
8 Crude petroleum products, Natural gas products 70 Other transport machinery
9 Ferrous ore 71 Generators
10 Non-ferrous ore mining 72 Household electric appliances
11 Salt mining 73 Other electric machinery and equipment
12 Non-metal minerals and other mining 74 Communication equipment
13 Grain mill products 75 Electronic computer
14 Feeding stuff production and processing 76 Other computer devices
15 Vegetable oil and forage 77 Electronic element and device
16 Sugar refining 78 Electronic appliances
17 Slaughtering, meat, eggs and dairy products 79 Other electronic and communication equipment
18 Prepared fish and seafood 80 Instruments, meters and other measuring equipment
19 Other food products 81 Cultural and office equipment
20 Wines, spirits and liquors 82 Arts and crafts products
21 Non-alcoholic beverage 83 Other manufacturing products
22 Tobacco products 84 Scrap and waste
23 Cotton textiles 85 Electricity and steam production
24 Woolen textiles 86 Gas production and supply
25 Hemp textiles 87 Water production and supply
26 Other textiles not classified 88 Construction
27 Knitted mills 89 Railway passenger transport
28 Wearing apparel 90 Railway freight transport
29 Leather, furs, related products 91 Highway freight and passengers transport
30 Sawmills and fibreboard 92 Domestic public transport
31 Furniture and products of wood, etc. 93 Water freight and passengers transport
32 Paper and products 94 Air passenger transport
33 Printing and record medium reproduction 95 Air freight transport
34 Cultural goods 96 Pipeline transport
35 Toys, sporting and athletic 97 Warehousing
36 Petroleum refining 98 Post
37 Coking 99 Telecommunication
38 Raw chemical materials 100 Computing services and software
39 Chemical fertilizers 101 Wholesale and retail trade
40 Chemical pesticides 102 Hotels
41 Chemicals for painting, dying and others 103 Eating and drinking places
42 Synthetic chemicals 104 Finance
43 Chemicals for special usages 105 Insurance
44 Chemical products for daily use 106 Real estate
45 Medical and pharmaceutical products 107 Leasehold
46 Chemical fibers 108 Business services
47 Rubber products 109 Tourism
48 Plastic products 110 Scientific research
49 Cement and cement asbestos products 111 General technical services
50 Glass and glass products 112 Geological prospecting
51 Pottery, China and earthenware 113 Water conservancy
52 Fireproof products 114 Environmental resources and public infrastructure
53 Other non-metallic mineral products 115 Resident services and other services
54 Iron-smelting 116 Educational services
55 Steel-smelting 117 Health services
56 Steel-processing 118 Social welfare
57 Alloy iron smelting 119 Culture and arts, radio, film and television
58 Nonferrous metal smelting 120 Sports
59 Nonferrous metal processing 121 Recreational services
60 Metal products 122 Public administration and other sectors
61 Boiler, engines and turbine 123 Re-export & Re-import
62 Metalworking machinery

References

1
Ye M, Wu J Q. Connotation and development of new-type building industrialization. China Construction News, 2013-02-26(005).
2
Li X D, Liu Z Q. Empirically analysis of investment expenditure structure in the financial system of chinese rural compulsory education. Journal of Central University of Finance & Economics, 2006,(5): 17- 21.
3
Tao F, Li L, Xia X H, et al. Industry efficiency and total factor productivity growth under resources and environmental constraint in China. The Scientific World Journal, 2012,(2): 1- 10.
4
Wang H, Wang C. The global business cycle mismatch, supply side reform and medium-high speed growth rate in China. Finance & Trade Economics, 2016, 37(2): 5- 19.
5
He B, Yun Z J, et al. Research progress of heavy metal pollution in China: Sources, analytical methods, status, and toxicity. Chinese Science Bulletin, 2013, 58(2): 134- 140.
6
Shen Y J. Several problems to be solved urgently in the current industrial restructuring in China. Journal of Guizhou Normal University, 2008, 24(8): 50- 52.
7
Zhou S L. Several problems in the adjustment and upgrading of China's industrial structure. China's Industrial Economy, 1998,(7): 22- 29.
8
Shi F, Liu H H. The evaluation of the comprehensive development level of modern service industry in China. Technology & Innovation Management, 2009, 30(3): 328- 331.
9
Hu B, Mcaleer M. Input-output structure and growth in China. Mathematics & Computers in Simulation, 2004, 64(1): 193- 202.
10
Baumol W J. Macroeconomics of unbalanced growth: The anatomy of urban crisis. American Economic Review, 1967, 57(3): 415- 426.
11
Ngai L R, Pissarides C A. Structural change in a multisector model of growth. American Economic Review, 2007, 97(1): 429- 443.
12
Liu W, Li S R. Industrial structure and economic growth. China Industrial Economics, 2002,(5): 14- 21.
13
Tian X, Bai F, Jia J, et al. Realizing low-carbon development in a developing and industrializing region: Impacts of industrial structure change on CO2 emissions in southwest China. Journal of Environmental Management, 2019, 233, 728- 738.
14
Guan H, Liu W, et al. Analyzing industrial structure evolution of old industrial cities using evolutionary resilience theory: A case study in Shenyang of China. Chinese Geographical Science, 2018, 28(3): 516- 528.
15
Ding S, Ma Q T, Miao Z Y. Analysis of industrial structure changes and influencing factors of employment in the process of economic development in Yunnan province. Journal of Chuxiong Normal University, 2010, 25(6): 77- 83. 77-83+95
16
Decheng F, Yu H. The driving factors research for industrial structure evolution: Based on the simulation analysis of the high technology industry. Journal of Applied Sciences, 2013, 13(21): 4535- 4539.
17
Liu H, Wang C X, Shi J L, et al. Influence factors of the regional industrial structure evolution in Shandong province of China against the background of low carbon. Journal of Landscape Research, 2013, 5(Z3): 13- 15.
18
Li H Y, Chi Y Y, Li J L, et al. Effect factors of China's industry structure based on redundancy analysis. International Conference on Machine Learning & Cybernetics, 2015.
19
Klepper S. The origin and growth of industry clusters: The making of Silicon Valley and Detroit. Journal of Urban Economics, 2010, 67(1): 15- 32.
20
Hioki S, Hewings G, Okamoto N. Identifying the structural changes of China's spatial production linkages using a qualitative input-output analysis. Journal of Econometric Study of Northeast Asia, 2005: (6). Avaiable online: https://www.researchgate.net/publication/251350375_Identifying_the _Structural_Changes_of_China's_Spatial_Production_Linkages_Using_a_Qualitative_Input-Output_Analysis.
21
Titze M, Brachert M, Kubis A. The identification of regional industrial clusters using qualitative inputoutput analysis. Regional Studies, 2011, 45(1): 89- 102.
22
Otero J D Q. Industrial structure and transmission of monetary policy in Latin American countries. Investigación Económica, 2018, 76(302): 103- 129.
23
Gao J, Tang X, Ren H, et al. Evolution of the construction industry in China from the perspectives of the driving and driven ability. Sustainability, 2019, 11(6): 1772.
24
Zhou S. Shallow interpretation of series expansion of complete consumption coefficient matrix. Research on Financial and Economic Issues, 1986,(6): 83- 85.
25
Currah A. Hollywood versus the Internet: The media and entertainment industries in a digital and networked economy. J. Econ. Geogr., 2006, 6(4): 439- 468.
26
Boar R G, Iovanovici A, Ciocarlie H, et al. Complex network interpretation of European Union economic dynamics. IEEE International Symposium on Applied Machine Intelligence and Informatics, 2017.
27
Li F F. The impact and suggestions of the "VAT reform" on taxation and financial accounting of the construction industry. Value Engineering, 2019, 38(36): 69- 70.
28
de la Torre S R, Kalda J, Kitt R, et al. On the topologic structure of economic complex networks: Empirical evidence from large scale payment network of Estonia. Chaos Solitons & Fractals the Interdisciplinary Journal of Nonlinear Science & Nonequilibrium & Complex Phenomena, 2016, 90, 18- 27.
29
Li B, Xiang P, Hu M, et al. The vulnerability of industrial symbiosis: A case study of Qijiang industrial park, China. Journal of Cleaner Production, 2017, 157, 267- 277.
30
Wang D, Li J, Wang Y, et al. Comparing the vulnerability of different coal industrial symbiosis networks under economic fluctuations. Journal of Cleaner Production, 2017, 149, 636- 652.
31
Schlesinger W H. The vulnerability of biotic diversity. Industrial Ecology and Global Change, 1994, 245- 260.
32
Molina-Morales F X, Capó-Vicedo J, Martínez-Fernández M T, et al. Social capital in industrial districts: Influence of the strength of ties and density of the network on the sense of belonging to the district. Papers in Regional Science, 2013, 92(4): 773- 789.
33
Lenzen M, Moran D, Kanemoto K, et al. Building eora: A global multi-region input-output database at high country and sector resolution. Economic Systems Research, 2013, 25(1): 20- 49.
34
Lenzen M, Kanemoto K, Moran D, et al. Mapping the structure of the world economy. Environmental Science & Technology, 2012, 46(15): 8374- 8381.
35
Chen Y, Liu F, Wu J. Studying users' interaction behaviors of sharing economic platform with 2-mode complex network analysis. Data Analysis & Knowledge Discovery, 2017, 1(6): 72- 82.
36
Lu G, Zhao L, An H G, et al. An empirical research on agriculturd network economy in Hebei province-Based on the complex network model of area correlation. Guangdong Agricultural Sciences, 2014, 41(23): 221- 226.
37
He B, Zhao H Y, An H Z, et al. The measure of Chinese managers research hotspots and trends based on the complex network method. Theory & Practice of Finance & Economics, 2014,(5): 102- 107.
38
Guo Y, Xue Y. Research on cooperative relations for identifying abnormal vertices in complex financial networks. International Conference on Electronic Commerce and Business Intelligence, 2009.

Funding

the National Key R&D Program of China(2018YFD1100203)
the National Natural Science Foundation of China(71801024)
Social Science Planning Project of Chongqing(2019QNGL30)
PDF(7136 KB)

240

Accesses

0

Citation

1

Altmetric

Detail

Sections
Recommended

/