1 Introduction
As one of the most important strategic materials, food has many functions in the fields of politics, economics, culture, society and ecology. Ensuring food security is the foundation, even the top priority, of the smooth running of a country. The definition of food security is mostly based on the following definition adopted by the World Food Summit (WFS) in 1996: " Food security refers to the state in which safe and nutritious availability of food by physical, social and economic means at all times by all people, which meets the needs of dietary and preferences in an active and healthy life1." This definition identifies four dimensions of food security: Availability, access, stability and utilization, and encompasses all aspects of good nutrition involving food and care. Since the publication of China's first Five-year Plan in 1953, China has attached great importance to food security and made it a top priority, recognizing that it is a concern for the national economy, people's livelihoods, national security and social stability. President Xi has pointed out that ensuring the continued production of agricultural products, especially grain, is the primary task of implementing China's rural revitalization strategy. China's rice bowl is in the hands of the Chinese people themselves, and that bowl is mainly filled with Chinese food. This shows that the Chinese government has a clear understanding of and attaches great importance to the issue of food security.
China has made important contributions to global food security, however many threats remain. China feeds 20 percent of the world's population with 10 percent of the world's arable land and 6 percent of the world's freshwater resources. It is basically self-sufficient with regards to major food crops, which makes an important contribution to world food security. However, high-input methods of food production are not sustainable and pose potential risks to food security. In 2017, China's cultivated land area was only 1.46 acres per capita, 1.43 acres less than the world's cultivated land area of 2.89 acres per capita on average. Furthermore, China uses much more water to grow crops as compared with developed countries; for example, China uses twice as much water for agriculture as the United States to produce the same amount of food. The scarcity of natural resources, such as water, coupled with such inefficient use cannot guarantee a stable food supply. In 2017, the self-sufficiency rate of China's soybean production was 7.87 percent, which posed a serious threat to China's animal husbandry and feed industries. During the US-China trade war, China has tried to wean itself away from depending on the United States by importing soybeans from other countries.
Agricultural science and technology can provide support to help ensure national food security, resolve issues that arise owing to the constraints of natural resources and the environment, and provide the decisive force to accelerate the construction of modern agriculture. The household contract responsibility system — by which the profits and losses of agricultural enterprises are the shared responsibility of several households — plays an important role in guaranteeing food security in China. However, the contradiction of this with modern agriculture is becoming more and more prominent, which hinders the extension and application of agricultural technology. The conversion rate from agricultural science and technology achievements to national implementation is low. There are more than 6, 000 scientific and technological achievements in the field of agriculture receive technical appraisal, examination and approval in China every year, but only a few of these achieve conversion into real productive forces, which is far lower than the 70 to 80 percent conversion rate seen in developed countries in Europe and America
[1]. At the same time, those who are engaged in agricultural management in China — especially those engaged in small-scale farming — are lacking in modern agricultural science and technology knowledge, which has led to an excessive application of fertilizers and pesticides resulting in low yields, poor quality crops and a series of other problems. The problem of popularizing agricultural science and technology — dubbed ' the last kilometer problem' — is one which the Chinese state is keen to solve. In addition, a large amount of capital flies from the grain industry, which requires the implementation of scientific and reasonable grain science and technology policies to guarantee food security.
To sum up, grain science and technology policies are key to ensuring China's food security. Such policies should promote relevant advances in the science and technology of the food industry to address food production, circulation and consumption issues efficiently.
In the existing literature, evaluation systems of food security have been fairly general. In terms of the measurement of food security, The Organization for Economic Co-operation and Development (OECD) and the UN's Food and Agriculture Organization (FAO) have jointly published the Agriculture Outlook annually since 2005. Supported by rich data and accurate forecasting models, the report forecasts how global agriculture will develop over the next decade. They use the AGLINK-COSIMO model to forecast the production, consumption and price of major agricultural products in more than 50 countries and regions, and to analyze and simulate the impact of various policies and other external factors on national and global agricultural products. DuPont and The Economist Intelligence Unit annually publish the Global Food Security Index. In their 2018 report, four dimensions were measured using a dynamic benchmark model: Food purchasing capacity, food supply capacity, food quality and security, and natural resources and resilience. China ranked 46th out of 113 countries2.
Many researchers have empirically studied the food security index
[2–4]. Coates
[5] established a food security evaluation system from the perspectives of food adequacy, nutrition adequacy, cultural acceptability and food stability. The Rural Socio-Economic Survey Division of China's National Bureau of Statistics evaluated China's food security from the point of view of supply, demand, market and inventory of China's food in 2004
[6]. Gong
[7] evaluated China's food security from the perspectives of food supply, food acquisition, food utilization and food security stability. Ma, et al.
[8] established an early warning system for food security in China from the perspectives of balancing the supply and demand of dietary energy, food production, food demand, and food reserves. Gao
[9] selected indicators of food production, demand, circulation and trade as relevant indicators by which to evaluate the situation of food security in China with the idea of " vertical step, horizontal classification". Li, et al.
[10] used the weighted average method in six indexes — grain self-sufficiency rate, grain sown area, grain production fluctuation coefficient, grain possession per capita, grain reserve level and food security status of the poor population — to establish China's food security evaluation system. Zhang, et al.
[11] constructed an index system which included eight aspects: Supply, distribution, consumption, security results, utilization efficiency, stability, sustainability and regulatory power, which showed that China's food security ranks highly. Cheng and Wang
[12] argued that the traditional food security strategy, which pays most of its attention to food quality security, needs to be revised to create a new food security strategy. Under a new food security strategy, Cui and Nie
[13] conducted an evaluation system to analyze the development of food security in China during the modern era.
Many researches have studied the effects of food policies around the world
[14–18]. The International Food Policy Research Institute (IFPRI) releases the Global Food Policy Report every year which details major areas of concern such as food policy progress, urbanization trends, and the impact of these trends on food security and nutrition in Africa, the Middle East, Central Asia, South Asia, East Asia, Latin America and the Caribbean. China's grain subsidy policy
[19–21], farmland protection policy
[22, 23] and agricultural insurance regulation
[24–26] were all mainly focused on the evaluation of China's grain support policies. Zhang, et al.
[27] believed that the grain subsidy and farmland protection policies would help to increase both grain production and farmers' incomes; they used the GTAP model to evaluate the effects of agricultural tax cancellation and the "four subsidies" policy. Candel and Pereira
[28] argued that an integrated food policy needs a consistent mix of policy instruments. Xu, et al.
[29] argued that a technology-centered scheme, such as China's, is good for agricultural sustainability. Nie and Li
[30] argued that grain science and technology policies are of vital importance to China's food security.
It can be concluded from previous studies that researches of food security have focused more on securing food quantity security and paid less attention to food quality security, ecological security, economic security, and resource and environmental security. However, this does not address the definition of food security used in the development strategy that China currently pursues. There has been much analysis of the impacts of supporting policies on food security, but few on the impacts of grain science and technology polices.
This paper will evaluate the guarantee of food security as follows. Firstly, a food security evaluation index system will be established which accounts for the contemporary definition of food security; it will evaluate the food security of provinces from the perspectives of quantity, quality, ecology, economic, and resource and environmental security. Secondly, grain science and technology policies will be sorted using the policy quantified method and an effectiveness index will be established to analyze trends in these policies. Thirdly, a dynamic panel model will be established for empirical analysis to identify the connection between policies and food security using provincial panel data. Finally, policy proposals which aim at guaranteeing food security will be put forward.
2 Assessment of China's Food Security
In this paper, a food security evaluation system will be established using existing research into quantity, quality, ecological, economic, and resource and environmental security in China. It will then analyze the provincial differences of food security in China, find weaknesses and deficiencies, and put forward policy suggestions.
2.1 Food Security Evaluation Index System
Food quantity security refers to improving the quantity of food in order to ensure the capacity to supply food and solve the problem that some people do not have " enough to eat". Quantity security is the basis of food security and the primary goal of food production in China. Quantity security of grain is measured by establishing a system of absolute quantity indicators including per capita grain possession, grain sown area and grain output per unit of cultivated area, and relative quantity indicators such as grain output volatility.
Quality security became a priority requirement for food security after it was included in the concept of food security in the new era. Quality security refers to ensuring a state in which people can get nutritious, healthy and safe food to meet their own needs, and to solve the problems of what is " safe to eat" and what is " healthy to eat". In consideration of publicly available data, the amount of pesticide applied per unit of cultivated area was used to evaluate food quality and security. This index is a negative index: The more pesticides used per unit of cultivated area, the more pesticide residue gets into the grain and the lower the ability to guarantee the quality of grain.
Food ecological security focuses on the sustainability of food production. In this paper, the amount of chemical fertilizer applied per unit of cultivated area and the proportion of grain disaster to sown area were used to measure the security of food ecological security.
There are two sides to the definition of food economic security. On the one hand, food economic security pays attention to people's ability to obtain food economically and what it solves is that people can afford food. On the other hand, especially in China, various subsidies guarantee food production and supply; these subsidies are also an important indicator of food economic security.
Food resource and environmental security focuses on the ability of food suppliers to supply under resource constraints, which is evaluated from the perspective of the cultivated land and the amount of water resources occupied per grain output.
These five dimensions of food security and the indicators used to evaluate them are summarized in Table 1.
Table 1 Indicators of food security evaluation index system |
| Dimension | Indicators |
| Quantity security | Grain output volatility |
| Grain sown area |
| Grain output per unit of cultivated area |
| Per capita grain availability |
| Quality security | Pesticide usage per unit of cultivated area |
| Ecological security | Fertilizer amount per unit of cultivated area |
| Proportion of disaster |
| Economic security | The financial support for agriculture |
| Engel coefficient |
| Resource and environmental security | Cultivated land area per grain output |
| Water resources occupied per grain output |
2.2 Data Sources and Weights
Data was collected from the National Bureau of Statistics' China Statistical Yearbook, the Chinese State Administration of Grain and Reserves' China Development Report of Grain, and the National Agricultural Cost-Benefit Data Collection.
All indicators are standardized in order to increase comparability among different indexes. For the positive indicator, data is processed as follows:
For the negative index, data is processed as follows:
The coefficient of variation method was used for weighting. Coefficient of variation (CV) is an objective weighting method which directly uses the information contained in each index for weighting. In the evaluation index system, the greater the difference in indicator value, the greater the difficulty of achieving the goal index and the greater the index weight.
where represents the coefficient of variation of indicator , represents the standard deviation of indicator , represents the average value of indicator , and represents the weight of indicator .
2.3 Food Security Assessment
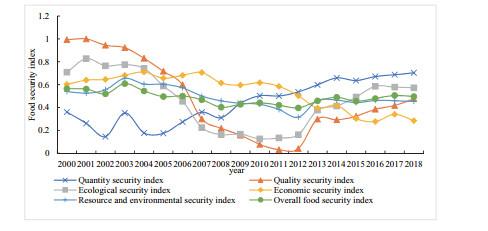
The food security index is distributed between 0 and 1. The closer the index is to 1, the higher the comprehensive level of food security will be.
From the perspective of the overall index of food security, the index of food security in main grain producing areas in China is generally high and the comprehensive level of food security remains stable. The provincial distribution of the food quantity security index shows the same trend as the total food security index, which reflects that food quantity security is an important support for the comprehensive level of food security to some extent.
According to the food security index created in this paper, as shown in Figure 1, food security in China is all-round developed. Ecological security, quality security, and resource and environmental security have improved rapidly, but economic security continues to decline. At present, the amount of pesticides and fertilizers applied per unit of cultivated area shows a downward trend, and the ecological and quality indexes show a good trend. However, the situation of food economic security continues to decline, which is mainly because farmers' grain production efficiency is low, land circulation is complicated and difficult, and high grain inventory brings with it the financial burden to increase. Chinese agricultural managers must pay more attention to these aspects. Overall, the national food security index shows a balanced development trend. With some small adjustments to the national food security strategy and the deepening of food policy reform, food economic security is bound to improve.
Figure 1 China's food security index in 20002018 |
Full size|PPT slide
3 Text Analysis of China's Grain Science and Technology Policies
Text analysis method is used in this section to analyze the characters and development of China's grain science and technology policies, and get the base data of policy which is explanatory variable in the empirical analysis.
3.1 Method and Data Sources
This paper introduces the methods of literature metrology, statistics and text analysis to conduct a quantitative analysis of grain science and technology policies in China. The aims are to reveal the developmental context of these policies, to analyze their objectives and effects, to grasp the background of the release of these policies and to identify trends for the future evolution of these policies. A total of 3, 892 local grain science and technology policies were collected with " food science and technology" as a key word, located in the databases of the Chinese government-supported CNKI and Peking University Law School. Issued by provinces and cities, 1, 699 copies of policy texts were screened according to the research relevance, which are sorted by various attributes including policy name, policy code, date of issue, effective date, expiry date, level of effectiveness and the full text of the policy.
3.2 Analysis of Grain Science and Technology Policies
3.2.1 Policy Effectiveness
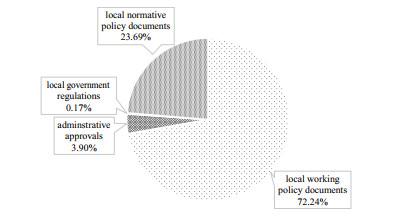
With regards to the legal effect of the policy, it should be noted that grain science and technology policies can be broken down into four main types: Local laws and regulations, local normative documents, local working documents, and administrative approvals. From 2004 to 2019, the grain science and technology policy was constituted of the following: Local working documents accounted for 72.24 percent, local normative documents accounted for 23.69 percent, 3.90 percent were administrative approvals and 0.17 percent were local government regulations. The implementation form of the grain science and technology policy is relatively diverse. This is shown by Figure 2.
Figure 2 Implementation forms of grain science and technology policy |
Full size|PPT slide
3.2.2 Policy Implementation Trends over Time
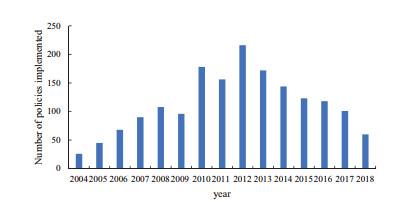
When plotted against a time axis, the number of grain science and technology policies implemented initially shows a growing trend followed by a decreasing trend. The number of grain science and technology policies promulgated shows a trend of gradual growth from 2004 to 2012, reaching a peak of 216 in 2012. Among them is the national agricultural science and technology innovation capacity construction plan (20122016), issued in 2012, which played a role in promoting the subsequent promulgation of grain science and technology policies. Since 2013, the number of policies implemented has decreased, but remains high. This is shown by Figure 3.
Figure 3 Number of grain science and technology policies implemented |
Full size|PPT slide
3.2.3 Policy Area Distribution
From the perspective of the provinces that issued the policies, Shandong province issued the most grain science and technology policies with 170 from 2004 to 2019, followed by Zhejiang province with 158 during the same period. The number of policies issued in eastern provinces is more than that of the central provinces, and the central provinces issued more than the western provinces.
Provinces can be grouped into three ' areas' — major grain producing areas, major grain selling areas and product-sale balance areas — as detailed in Table 2. Major grain producing areas implemented the most grain science and technology policies; their 825 policies accounted for 48.56 percent of the policies analyzed. Major grain selling areas published 482 grain science and technology policies, accounting for 28.37 percent. Product-sale balance areas published 392 grain science and technology policies, accounting for 23.073.
3 According to the classification criteria used by the National Medium- and Long-term Plan for Food Security (20082020).
Table 2 Distribution of policies by area |
| Major grain producing areas | Liaoning, Hebei, Shandong, Jilin, Inner Mongolia, Jiangxi, Hunan, Sichuan, Henan, Hubei, Jiangsu, Anhui and Heilongjiang | 48.56 percent |
| Major grain selling areas | Beijing, Tianjin, Shanghai, Zhejiang, Fujian, Guangdong, Hainan | 23.07 percent |
| Product-sale balance areas | Shanxi, Guangxi, Chongqing, Guizhou, Yunnan, Xizang, Shaanxi, Gansu, Qinghai, Ningxia and Xinjiang | 28.37 percent |
3.2.4 Policy Contents
Grain science and technology policies focus on grain science and technology infrastructure, platform support, talent incentives, science and technology finance and financial support, and the promotion of science and technology.
Grain science and technology infrastructure policies are the main type of grain science and technology policy and cover a variety of topics including major science and technology facilities, setting up the national agricultural development zone for new and high technology industries, research and development platforms, establishing agricultural science and technology innovation centers, setting up information service platforms, establishing an industry-wide innovation alliance, etc. The chief aim of policies on grain science and technology platforms is to create a guarantee of support for the main bodies of relevant platforms engaged in food science and technology, including the establishment of an agricultural industrialization organization; the establishment of agricultural science and technology financing, information and brand service platforms; and other services essential to the industry. The talent incentive policy focuses on a policy of introducing and cultivating leading talents in the field. Fiscal and financial support policies for grain science and technology are mainly intended to stimulate various innovation entities, including policies for strengthening foundation projects and for providing tax relief, fiscal subsidies, capital turnover, financing, and science and technology bonds.
4 Empirical Analysis
Provincial dynamic panel model is introduced in this section to test the effect of grain science and technology policies on food security.
4.1 Research Hypotheses
Hypothesis 1 Other things being equal, the release frequency of grain science and technology policies has a positive impact on food security.
The release of grain science and technology policies is conducive to the improvement of the scientific and technological level of China's food industry. The more frequently science and technology policies are released, the stronger the pertinence, precision and guidance the policy will be, which is conducive to ensuring food security.
Hypothesis 2 Other things being equal, the greater the effectiveness of the implementation of a new grain science and technology policy, the more positive an impact this will have on food security.
The more effective the implementation of a grain science and technology policy, the greater the support from the food industry of that policy and the wider the impact of the policy, which is conducive to ensuring food security.
4.2 Data and Model
The food security of a province is affected by many factors. Food security is not only affected by basic input factors — such as labor, machinery, water resources, the cost of production and other inputs — but it is also affected by the security level of grain science and technology policies. Considering the behavioral inertia of food production, this paper introduces the lagging two periods of food security index into the model to better investigate the guarantee of food security by grain science and technology policies. A dynamic panel data model is established as follows:
where is the cross-sectional individual ; is time; is the intercept term; is the random error term; represents the provincial food security index as well as the food quantity security index, quality security index, ecological security index, economic security index, and resources and environmental security index; represents the degree of implementation of the provincial grain science and technology policy; represents the effective food irrigation area of the province; represents the food industry labor of the province; represents the total power of the food industry machinery of the province; and represents the price indices of means of agricultural production of the province. This is shown by Table 3.
Table 3 Definitions and meanings of variables |
| Variable symbol | Variable name | Data source |
| Explained variables |
| Safeind | Food security index | Calculated according to the food security index system |
| Quansind | Food quantity security index |
| Qualsind | Food quality security index |
| Ecolsind | Food ecological security index |
| Econsind | Food economic security index |
| Resosind | Food resource and environmental security index |
| Explanatory variables |
| PolicyQ | The number of grain science and technology policies implemented | Database of Peking University Law School and the CNKI policy database |
| PolicyP | The cumulative effect of grain science and technology policies |
| Control variables |
| IA | Effective irrigated area | China Statistical Yearbook |
| Labor force in the food industry |
| Grain industry machinery total power |
| ppi | Price index of agricultural means of production |
The cumulative effect of grain science and technology policies is defined as follows. To obtain the effectiveness of a grain science and technology policy in each province, this paper assigns 1, 0.9, 0.8 and 0.7 to local laws and regulations, local normative documents, local working documents and local administrative approvals respectively. To reflect the cumulative impact of policies, is brought into the model to represent the cumulative effect of grain science and technology policies on the current year's food production, where
represents the effective force of grain science and technology policies in the current period, and represents the ineffective force of grain science and technology policies in the current period.
This paper adopts provincial scale data for research. This paper adopts the data of the remaining 27 provinces for empirical research, considering the data availability of Taiwan, Hong Kong and Macao, the lack of price index data of agricultural production in Shanghai, Tianjin and Chongqing, and the lack of grain science and technology data in Tibet.
Due to lack of separate statistics on the food industry in the current statistical system, the effective irrigation area of grain, food industry labor and total machinery power were separated from the effective irrigation area of agriculture, animal husbandry, fishery, rural workers and agricultural total machinery power according to the area sown to grain accounts for the proportion of the total. All variables are summarized by Table 4.
Table 4 Descriptive statistics |
| Variable | Obs | Mean | Std. Dev. | Min. | Max. |
| Safeind | 405 | 2.785 | 0.582 | 1.188 | 5.495 |
| Quansind | 405 | 0.635 | 0.462 | 0.000 | 3.154 |
| Qualsind | 405 | 0.505 | 0.262 | 0.000 | 1.000 |
| Ecolsind | 405 | 0.502 | 0.253 | 0.000 | 1.118 |
| Econsind | 405 | 0.552 | 0.238 | 0.000 | 1.009 |
| Resosind | 405 | 0.591 | 0.274 | 0.000 | 1.387 |
| IA | 405 | 1543.483 | 1176.895 | 58.793 | 5928.227 |
| 405 | 658.513 | 449.084 | 26.700 | 2104.330 |
| 405 | 2304.482 | 2119.341 | 67.360 | 9863.675 |
| ppi | 405 | 104.855 | 6.175 | 93.314 | 128.051 |
| PolicyQ | 405 | 5.267 | 4.674 | 1.000 | 22.000 |
| PolicyP | 405 | 4.316 | 3.792 | 0.700 | 18.200 |
4.3 Model Estimation
4.3.1 Unit Root Test
LLC and IPS tests
[31] are conducted to check the stationarity of data before estimating the model. As shown by
Table 5, the unit root exists in the labor force employed in the food industry, but not in the first-order difference of the sequence.
Table 5 Unit root test results of panel data |
| Variation | IPS | LLC | Conclusion |
| lSafeind | 3.9690
(0.0000) | 3.4936
(0.0002) | stationary |
| lQuansind | 4.2820
(0.0000) | 3.7190
(0.0001) | stationary |
| lQualsind | 2.3210
(0.0101) | 6.1744
(0.0000) | stationary |
| lEcolsind | 4.3861
(0.0000) | 4.5369
(0.0000) | stationary |
| lEconsind | 4.5595
(0.0000) | 4.5391
(0.0000) | stationary |
| lResosind | 2.1206
(0.0170) | 6.0904
(0.0000) | stationary |
| PolicyQ | 6.1963
(0.0000) | 6.5044
(0.0000) | stationary |
| PolicyP | 6.3284
(0.0000) | 6.8364
(0.0000) | stationary |
| lIA | 1.0359
(0.1501) | 4.8637
(0.0000) | stationary |
| lL | 1.9047
(0.9716) | 1.6669
(0.9522) | non-stationary |
| lM | 4.6230
(0.0004) | 11.3629
(0.0000) | stationary |
| ppi | 11.6851
(0.0000) | 15.2050
(0.0000) | stationary |
| 13.0922
(0.0000) | 17.6353
(0.0000) | stationary |
4.3.2 Co-Integration Test
A co-integration test is conducted on the panel data in order to check whether there is a long-term co-integration relationship between the labor force and the food security index. Kao, Pedroni and Westerlund test methods were used, and the null hypothesis was that there was no co-integration relationship. The results in Table 6 show that there is a long-term stable relationship between the food security indexes and the labor force employed in the food industry.
Table 6 Results of co-integration test |
| Ho: No cointegration | | lSafeind & lL | lQuansind & lL | lQualsind & lL | lEcolsind & lL | lEconsind & lL | lResosind & lL |
| Kao | Modified Dickey Fuller | 4.1166
(0.0000) | 3.2715
(0.0000) | 0.5047
(0.3069) | 2.3115
(0.0100) | 0.3210
(0.3741) | 0.1803
(0.4284) |
| Dickey Fuller | 3.3973
(0.0003) | 3.8375
(0.0001) | 2.9097
(0.0018) | 3.8029
(0.0001) | 2.6665
(0.0038) | 0.8958
(0.1852) |
| Augmented Dickey Fuller | 1.1956
(0.1159) | 1.5250
(0.0636) | 0.4771
(0.3167) | 0.9594
(0.1687) | 2.5452
(0.0055) | 1.8042
(0.0356) |
| Unadjusted modified Dickey Fuller | 7.2005
(0.0000) | 9.1011
(0.0071) | 7.2834
(0.0000) | 6.6663
(0.0021) | 8.7797
(0.0000) | 2.8395
(0.0023) |
| Unadjusted Dickey Fuller | 4.6196
(0.0000) | 6.2868
(0.0120) | 6.7362
(0.0015) | 5.8467
(0.0910) | 8.2069
(0.0000) | 2.8804
(0.0020) |
| Pedroni | Modified Phillips - Perron | 0.8803
(0.1894) | 1.4136
(0.0787) | 0.9055
(0.1826) | 0.9543
(0.0000) | 0.1336
(0.4469) | 0.5443
(0.2931) |
| Westerlund | Variance thewire | 1.6032
(0.0545) | 2.3001
(0.0107) | 1.9383
(0.0263) | 2.4954
(0.0063) | 1.6378
(0.0507) | 0.6265
(0.2655) |
4.3.3 Regression Analysis
It is important to estimate any dynamic panel model using the system GMM estimation method
[32]. The GMM method is used for regression estimation using Stata 15.1 software. In terms of the selection of instrumental variables, the Sargan test shows that all models accept the null hypothesis of the validity of instrumental variables, and the first-order and second-order sequence correlation tests show that all models have passed the sequence correlation test of interference terms. The regression results are shown in
Tables 7 and
8.
Table 7 Regression results of policy frequency |
| | Food security | Quantity security | Quality security | Ecological security | Economic security | Resource and environmental security |
| PolicyQ(2) | 0.0776*** | 0.1622** | 0.0017 | 0.2195*** | 0.0991 | 0.1088* |
| | (4.10) | (2.18) | (0.03) | (2.99) | (1.41) | (1.77) |
| lIA | 0.0217 | 0.0333 | 0.1710 | 0.2040 | 0.0657 | 0.1420 |
| | (0.36) | (0.16) | (0.93) | (0.91) | (0.26) | (0.63) |
| dL | 0.0004 | 0.0019 | 0.0002 | 0.0006 | 0.0003 | 0.0012 |
| | (1.30) | (1.36) | (0.24) | (0.46) | (0.20) | (1.03) |
| lM | 0.0122 | 0.3600 | 0.4775*** | 0.4420** | 0.0631 | 0.4370** |
| | (0.24) | (1.58) | (2.91) | (2.08) | (0.33) | (2.38) |
| lppi | 0.1799 | 0.5789 | 0.4134 | 1.0587** | 0.5992 | 0.5708 |
| | (1.50) | (1.18) | (1.17) | (2.23) | (1.32) | (1.35) |
| L.l Safeind | 0.1340* | | | | | |
| | (1.74) | | | | | |
| L.l Quansind | | 0.1517*** | | | | |
| | | (2.65) | | | | |
| L.l Qualsind | | | 0.4921*** | | | |
| | | | (11.79) | | | |
| L.l Ecolsind | | | | 0.4165*** | | |
| | | | | (9.03) | | |
| L.l Econsind | | | | | 0.2788*** | |
| | | | | | (6.39) | |
| L.l Resosind | | | | | | 0.5960*** |
| | | | | | | (15.36) |
| _cons | 1.6192** | 0.7964 | 4.6008*** | 7.2847*** | 3.2495 | 0.1494 |
| | (2.34) | (0.31) | (2.64) | (3.03) | (1.35) | (0.07) |
| Sargan test | 0.0000 | 0.0000 | 0.0000 | 0.0000 | 0.0000 | 0.0000 |
| 378 | 376 | 350 | 369 | 368 | 373 |
Table 8 Regression results of the cumulative effect of policies |
| | Food security | Quantity security | Quality security | Ecological security | Economic security | Resource and environmental security |
| L.l Safeind | 0.0177 | | | | | |
| | (0.23) | | | | | |
| tpolicyP() | 0.0006*** | 0.0005 | 0.0004* | 0.0011** | 0.0011*** | 0.0010*** |
| | (5.20) | (1.40) | (1.70) | (2.05) | (2.59) | (3.34) |
| lIA | 0.2090*** | 0.0300 | 0.2702 | 0.0267 | 0.1243 | 0.2163 |
| | (2.78) | (0.13) | (1.41) | (0.11) | (0.50) | (0.96) |
| dL | 0.0002 | 0.0014 | 0.0004 | 0.0018 | 0.0004 | 0.0005 |
| | (0.61) | (1.05) | (0.40) | (1.35) | (0.29) | (0.45) |
| lM | 0.0327 | 0.3695 | 0.5107*** | 0.3099 | 0.1915 | 0.4583** |
| | (0.65) | (1.60) | (3.13) | (1.40) | (1.01) | (2.51) |
| lppi | 0.1001 | 0.4439 | 0.4642 | 1.3613*** | 0.6336 | 0.3947 |
| | (0.85) | (0.90) | (1.32) | (2.81) | (1.41) | (0.93) |
| L.l Quansind | | 0.1603*** | | | | |
| | | (2.82) | | | | |
| L.l Qualsind | | | 0.4741*** | | | |
| | | | (11.08) | | | |
| L.l Ecolsind | | | | 0.4400*** | | |
| | | | | (9.37) | | |
| L.l Econsind | | | | | 0.2544*** | |
| | | | | | (5.72) | |
| L.l Resosind | | | | | | 0.5971*** |
| | | | | | | (15.50) |
| _cons | 2.3190*** | 1.2734 | 4.6614*** | 9.5451*** | 3.3331 | 0.8480 |
| | (3.39) | (0.50) | (2.70) | (3.61) | (1.40) | (0.38) |
| Sargan test | 0.0000 | 0.0000 | 0.0000 | 0.0000 | 0.0000 | 0.0000 |
| 378 | 376 | 350 | 369 | 368 | 373 |
According to the regression results of the effect of the frequency of grain science and technology policies on food security, the release frequency of grain science and technology policies passed the significance test, which is shown in Table 7. Theoretically, under the premise of consistent policy direction, the higher the frequency of policy release, the stronger the pertinence of policy regulation, the higher the accuracy and the greater the guiding force. China's grain science and technology policies belong to the food support policy. The higher the frequency of release, the more targeted it is to the development of the food industry, the more accurate it is to support the weak board and the greater the guarantee of food security. The empirical results of this paper therefore support Hypothesis 1.
In addition to the quality security index and economic security index, the release frequency of grain science and technology policies has a positive impact on the overall food security index, food quantity security index, food ecological security index, and food resource and environmental security index. According to the regression coefficient, the total food security index is 7.76 percent higher, the quantity security index is 16.22 percent higher, the ecological security index is 21.95 percent higher, and the resource and environmental index is 10.88 percent higher in the provinces where the frequency of the release of grain science and technology policies is higher (that is, more than 10 items per year) than in the provinces where the frequency of the release of grain science and technology policies is lower.
As shown in Table 8, the cumulative effect of grain science and technology policies passed the significance test. Theoretically, the cumulative effect of grain science and technology policies support each link in the development of the food industry. This empirical result supports Hypothesis 2. In addition to the grain economic security index, the cumulative effect of grain science and technology policies has a positive effect on the overall food security index, food quantity security index, food economic security index, ecological security index, and food resource and environmental security index. In terms of regression coefficient, for every 1 percent increase in the cumulative effect of grain science and technology policies, the overall food security index, quantity security index, quality security index, ecological security index, and resource and environmental security index increases by 0.06 percent, 0.05 percent, 0.04 percent, 0.11 percent and 0.10 percent respectively.
4.4 Robustness Analysis
The influence of grain science and technology policies on food security in main grain producing areas, main grain selling areas and product-sale balance areas is heterogeneous due to the significant provincial differences in grain production in China. In order to verify the robustness of the model, the samples were divided into major grain producing areas, major grain selling areas and product-sale balance areas for regression analysis. At the same time, this paper also tests the robustness of the cumulative effect of grain science and technology policies. Grain production areas are set as dummy variables to enter the model. The results are shown in Table 9.
| | (1) | (2) | (3) | (4) |
| | Major grain producing areas | Major grain selling areas | Product-sale balance areas | Full sample |
| L.l Safeind | 0.2036** | 0.2010* | 0.5597*** | 0.0296 |
| | (2.26) | (1.93) | (6.18) | (0.37) |
| PolicyQ() | 0.0760*** | 0.1106*** | 0.0133 | |
| | (2.62) | (3.40) | (0.43) | |
| tPolicyP() | | | | 0.0006*** |
| | | | | (4.61) |
| lIA | 0.2082** | 0.0207 | 0.0166 | 0.2272*** |
| | (2.10) | (0.16) | (0.22) | (2.61) |
| dL | 0.0005 | 0.0001 | 0.0002 | 0.0002 |
| | (1.12) | (0.09) | (0.21) | (0.54) |
| lM | 0.0147 | 0.0005 | 0.0324 | 0.0351 |
| | (0.22) | (0.00) | (0.55) | (0.69) |
| lppi | 0.0988 | 0.1922 | 0.0064 | 0.0924 |
| | (0.56) | (0.67) | (0.03) | (0.77) |
| qu2 | | | | 0.1237 |
| | | | | (0.40) |
| qu3 | | | | 0.0764 |
| | | | | (0.48) |
| _cons | 0.2183 | 0.0302 | 0.7552 | 2.3542*** |
| | (0.19) | (0.02) | (0.63) | (2.80) |
| Sargan test | 0.0000 | 0.0000 | 0.0000 | 0.0000 |
| 182 | 70 | 126 | 378 |
The regression results show that the influence of policy frequency on food security has passed the significance test in the major grain producing areas and major grain selling areas, but has not passed the significance test in the product-sale balance areas. This indicates that the influence of grain science and technology policies is heterogeneous, which is more significant in main producing areas and main selling areas.
According to the regression results, the cumulative effect of grain science and technology policies on food security is robust.
It can be seen from the estimation results of the dynamic panel regression that the release frequency and cumulative effect of grain science and technology policies both have a positive and robust impact on the overall food security index, quantity security index, quality security index, economic security index, ecological security index, and food resource and environmental security index.
The influence of grain science and technology policies on food security in major grain producing areas, major grain selling areas and product-sale balance areas is heterogeneous. The frequency of policy release has a more positive effect on the food security index in major grain producing areas and major grain selling areas than in production-sale balance areas.
5 Conclusions and Implications
In this paper, a new food security evaluation system was introduced which considered five dimensions food security — namely quantity security, quality security, ecological security, economic security, and resource and environmental security — with the goal of analyzing the new concept of food security in the modern era. According to the research results, the comprehensive level of food security in major grain producing areas is generally high and their regional distribution is basically consistent with the quantitative security, which indicates that the quantitative security of food is an important supporting part of overall food security. The food economic security index is relatively low compared with other indexes and the problem of food economic security is prominent in China; this is related to large financial burdens in the food industry.
At the same time, this paper analyzed China's grain science and technology policies since 2004, looking at aspects including policy effectiveness, release time, policy provincial distribution and policy tool selection by means of textual econometric analysis. During the period of the 12th Five-year Plan (2011 to 2016), China's grain science and technology policies have frequently been released, which is related to the promulgation of relevant grain science and technology plans. In terms of the contents of the grain science and technology policies, infrastructure construction, incentives for innovative platforms, policies to incentivize talent, and science and technology financing are the main forms of policy.
A dynamic panel model was established to verify the influence of the release frequency and the cumulative effect of grain science and technology policies on food security. With a certain policy support direction, the more frequently grain science and technology policies are released, the more targeted the policy is, the more accurate the policy is, the greater the guiding force is, and the greater the guarantee is for food security. Similarly, the higher the cumulative effect of grain science and technology policies, the greater the support for the food industry is, and the more beneficial it is to guaranteeing China's food security.
On the basis of this research, the following suggestions are proposed.
Policymakers should pay more attention to food economic security. Purchase and storage systems should be gradually improved by encouraging multi-subject grain storage, making overall plans for policy- and market-based purchases, and increasing support for the purchase of grain processing enterprises and diversified market entities. Practice market pricing and the separation of price and subsidies. Establish a socialized grain reserve service mechanism, adapting to the characteristics of China's grain market gradually by way of a government purchasing service.
Policymakers should give play to the role of science and technology in steadily increasing grain productivity and continue to increase agricultural production capacity and increase the yield of grain per unit area relying on science and technology. Stabilize the ranks of agricultural science and technology popularization, actively promote the reform of the agricultural science and technology systems, and increase the contribution of scientific and technological progress to grain production. Accelerate the reform of the agrotechnical popularization system in line with the development of the market economics. The combination of production, learning and research will improve the efficiency of the transformation of scientific and technological achievements, so that future scientific research achievements can effectively serve the production, circulation and consumption of grain. Implement highly targeted, highly accurate and highly guided policies on food science and technology, which will ensure that science and technology can efficiently serve the national strategy on food security.
{{custom_sec.title}}
{{custom_sec.title}}
{{custom_sec.content}}
 PDF(308 KB)

 Table 1 Indicators of food security evaluation index system
 Figure 1 China's food security index in 2000


