An Empirical Study of Public Response to a Waste-to-Energy Plant in China: Effects of Knowledge, Risk, Benefit and Systematic Processing

Xiongwei QUAN, Gaoshan ZUO

Journal of Systems Science and Information ›› 2022, Vol. 10 ›› Issue (1) : 35-50.

PDF(252 KB)
PDF(252 KB)
Journal of Systems Science and Information ›› 2022, Vol. 10 ›› Issue (1) : 35-50. DOI: 10.21078/JSSI-2022-035-16
 

An Empirical Study of Public Response to a Waste-to-Energy Plant in China: Effects of Knowledge, Risk, Benefit and Systematic Processing

Author information +
History +

Abstract

With the development of urbanization in China, tons of municipal solid waste have been produced and disposed Incineration is the best way to deal with municipal solid waste in China but this practice often is opposed and resisted by the public who live nearby. This study systematically analyzed the risk responses of the public, in particular factors affecting the public's resistant behavior We conducted a survey and collected 376 valid questionnaires which we used for the analysis. We used the structural equation model and path analysis for the examination, and the results showed that risk perception was a critical factor predicting the resistant behavior of the public surrounding the wasteto-energy (WTE) plant. Benefit perception had a negative, but insignificant, impact on the public's resistant behavior. We found a negative correlation between benefit perception and risk perception but the relationship was weakened when we added systematic processing to the path analysis. The impact of system processing on risk perception was greater than that of benefit perception; that is, systematic processing was better in explaining the risk judgment of the public than benefit perception. Problem knowledge was a significant indicator in predicting risk perception and systematic processing and technology knowledge was a significant indicator in predicting risk perception and benefit perception. Systematic processing increased the public's risk judgment to the WTE plant. Finally, we discussed practical implications and limitations.

Key words

waste-to-energy plant / knowledge / risk perception / systematic processing / resistant behavior

Cite this article

Download Citations
Xiongwei QUAN , Gaoshan ZUO. An Empirical Study of Public Response to a Waste-to-Energy Plant in China: Effects of Knowledge, Risk, Benefit and Systematic Processing. Journal of Systems Science and Information, 2022, 10(1): 35-50 https://doi.org/10.21078/JSSI-2022-035-16

1 Introduction

In recent years, with the development of urbanization in China, tons of municipal solid waste (MSW) have been produced and disposed. According to data from the Ministry of Housing and Urban-Rural Development of China, the amount of MSW in China increased from 163.9528 million tons in 2011 to 228.0175 million tons in 2018, with an average annual growth rate of about 5%. The harmless disposal of MSW increased from 130.8964 million tons in 2011 to 225.6536 million tons in 2018, with an average annual growth rate of about 8%. Therefore, rapidly developing Chinese cities are facing a severe MSW problem.
In China, the harmless disposal of MSW mainly includes sanitary landfill, incineration, and other methods. Incineration not only effectively reduces MSW but also provides electric power for cities. More important, incineration is less harmful than sanitary landfill to the environment and has been used widely to reduce the amount of MSW[1]. Therefore, incineration is listed as the preferred waste disposal method in China. Like other unpopular facilities, however, one of the biggest obstacles to locating and building waste-to-energy (WTE) plants is opposition from the surrounding public[2, 3]. This opposition has been well-documented as the not-in-my-backyard (NIMBY) phenomenon[4-7] According to Yang[8], the mass incident induced by environmental problems in China has increased by 29% per year, and the degree of conflict has been obviously higher than that of other types of mass incidents. Some scholars believe that China has entered into the "era of NIMBY"[9]. Thus, the real question about the location and construction of such facilities may not be about the attitude of the surrounding public but rather whether the government can effectively alleviate the existing or upcoming opposition and resistance[2].
Lazarus[10] and Lazarus and Folkman[11] recognized that when faced with a potentially hazard event, people would simultaneously engage in activities to attempt to manage a threatening situation (i.e., problem-focused coping behavior) as well as attempt to adjust their emotional response to the event (i.e., emotion-focused coping behavior). Lindell and Perry[12] divided individuals' behavioral responses under natural environment risk and hazard events into information-seeking behavior, protective coping behavior (i.e., problem-focused coping behavior), and emotion-focused coping behavior. Recently, as environmental issues have become much more prominent, more and more attention has been paid to the public's environmental risk behavioral responses. These environmental risk behavioral responses have been divided primarily into the following categories: Pro-environmental behavior (PEB), environmental risk-averse behavior, and environmental resistant behavior[13]. PEB refers to the behavior of the public to protect the environment by constantly adjusting or changing their own activities to reduce negative impacts on the ecological environment[14, 15]. Environmental risk-averse behavior usually refers to a kind of risk-averse behavior achieved by changing one's own living habits after the environmental hazard has occurred, such as moving out of the risk area, reducing the behavior of going out, or closing doors and windows[16]. Environmental resistant behavior is a more radical response, which may force the initial "rational expression" into "violent conflict" in the case of ineffective communication, thus deepening social opposition[17]. Gattinara and Froio[18] further divided the public's resistant behaviors into five categories according to the degree of radicalization, including conventional behavior, demonstrative behavior, expressive behavior, confrontational behavior, and violent behavior. Zeng[13] classified the public's risk response behaviors into two categories: Positive response behavior (such as information seeking and resistance) and risk-averse response behavior (such as moving out and purchasing radiation-protection supplies). Resistant behavior can be further classified into two categories: conventional behavior (such as making a public speech, signature campaigns) and demonstrative behavior (such as petition, demonstration). Hence, we drew lessons from the research of Gattinara and Froio[18] and Zeng[13] on the public's resistant behavior and focused on the public's risk behavioral response to WTE plants in expressive behavior (such as hanging protest banners and participating in signature campaigns) and demonstrative behavior (such as petitions and demonstrations). The purpose of this study was to systematically analyze the factors affecting these two kinds of behavior of the surrounding public to the WET plants in China. This paper is organized as follows: Section 2 is the theoretical model; Section 3 is methods; Section 4 is results; Section 5 is discussion and applications.

2 Theoretical Model

2.1 Risk Perception

Risk perception is a psychological terminology that, since the 1980s, has attracted widespread attention in the literature. Slovic[19] recognized that the majority of citizens rely on intuitive risk judgments to evaluate hazards, typically called "risk perceptions." Risk perception is considered to be a subjective assessment to the probability of a specific event, which features two aspects: The subjective assessment of the probability of an event occurring and the subjective assessment of the severity of the results of the event[20-22]. In the protective action decision model (PADM), risk perception is considered to be an important factor influencing people's behaviors in response to risk events[12]. In empirical research, many findings have found a significant positive relationship between risk perception and behavioral responses[13, 23-30]. Some studies, however, have not found a significant difference between risk perception and public response. For example, Perry and Lindell[31] determined that risk perception was not a statistically significant predictor of protective behaviors for wildfires, earthquakes, or volcanic activity. In general, however, risk perception is still a good predictor of public response to risk. Nonetheless, in the scenario of a WTE plant, the influence of risk perception on public risk behavior response has not been widely examined. Therefore, in this study, we examined the impact of risk perception on public behavior under the scenario of a WTE plant. On the basis of previous research and analysis, we devised the following hypothesis:
H1: There is a significant positive relationship between risk perception and the surrounding public's expressive and demonstrative behavior toward a WTE plant.

2.2 Hazard Knowledge

Johnson[32] recognized that knowledge is meaningful and multidimensional information. Meaning is not inherent in information; it needs to be interpreted, turning mere data into something that can be analyzed and acted upon. Lindell and Perry[33] recognized that hazard knowledge generally refers to information on causes, exposure mechanisms, and types of risk adjustments that can avoid the impact of a hazard. A large number of studies have shown that people with a higher level of knowledge are more likely to take risk protective behaviors or to respond accordingly. Most of these studies have identified a positive relationship between hazard knowledge and risk responses[13, 34-36], but some studies have suggested that overconfidence in skills and knowledge may also cause people with higher levels of knowledge to be less willing to take risk-coping actions[32, 37]. Other studies have suggested that no significant correlation exists between knowledge and risk-coping actions[26, 38]. Therefore, no consistent conclusion has been drawn on the impact of hazard knowledge on public risk behavioral responses. In addition, the relationship between knowledge and behavioral response has not been tested in the case of WTE plant.
Additionally, many studies have examined the relationship between hazard knowledge and risk perception. In general, this body of research has suggested that a lack of relevant knowledge leads to higher risk assessment and judgment[39-42]. McDaniels, et al.[43] and Zeng[13], however, identified that having more knowledge increased the public's awareness of higher risk perception. Furthermore, Peacock, et al.[44] and Ge, et al.[26] reported that knowledge had no effect on the public's risk perception. In short, the effects of knowledge on risk perception have been found to be variable[32, 44].
According to the Heuristic-Systematic Information Processing (HSIP) model, knowledge is an important variable that affects people's information processing strategies[45]. For example, Trumbo and McComas[46] found that when individuals had a lot of prior knowledge about a problem, they were more motivated and able to process information about it. Wei, et al.[36] showed that higher levels of product knowledge increased the public's tendency to process information systematically. Kahlor, et al.[47] argued that current knowledge had a positive impact on systematic processing and a negative impact on heuristic information processing but that both were not statistically significant.
In addition, we have collected two studies on knowledge and benefit perception. The results showed that having more knowledge increased the public's benefit perception[13, 40].
In summary, knowledge is an important antecedent variable, and its impact on risk response, risk perception, benefit perception, and information processing has attracted the attention and research of many scholars. Different conclusions have been drawn, however, because of the different interpretations and measures of knowledge and different risk scenarios. In this study, we measured public knowledge in terms of both a problem and technology. On the basis of the noted research and analysis, we devised the following hypotheses:
H2a: There is a significant positive relationship between problem knowledge and the surrounding public's expressive and demonstrative behavior to a WTE plant.
H2b: There is a significant negative relationship between technology knowledge and the surrounding public's expressive and demonstrative behavior to a WTE plant.
H2c: There is a significant positive relationship between problem knowledge and risk perception.
H2d: There is a significant negative relationship between technology knowledge and risk perception.
H2e: There is a significant negative relationship between problem knowledge and benefit perception.
H2f: There is a significant positive relationship between technology knowledge and benefit perception.
H2g: There is a significant positive relationship between problem knowledge and systematic processing.
H2h: There is a significant negative relationship between technology knowledge and systematic processing.

2.3 Information Processing

According to the HSIP model, individuals follow two different patterns when processing of information: Heuristic or systematic strategies. Systematic processing involves trying to understand any available information thoroughly through careful review, in-depth thinking, and rigorous reasoning. Systematic processing generates more confidence in judgments but requires more effort and is time-consuming. Heuristic processing involves focusing on obvious clues to make a judgment. Heuristic processing is a more effective and relatively automatic processing mode, but more often, it generates less confidence in judgments[45, 48]. The primary consequence of these two information-processing modes is that the heuristic judgments tend to be less stable and are less associated with the subsequent behavior than the systematic judgments[46]. In addition, the risk information seeking and processing (RISP) model holds that individuals who seek more risk information and systematically process it will show more determined risk-avoidance behavior[49]. Hovick, et al.[50] and Wei, et al.[36] empirically affirmed that systematic information processing will increase the corresponding risk behavioral response.
The HSIP model holds that when individuals try to evaluate information to make a judgment about risk, they use one or both of these two strategies[51]. This HSIP model does not predict how the processing modes affect the public's risk perception[52]. Most of the literature about risk suggests that unnecessary overreaction to risk can be reduced by allowing people to think rationally and systematically[51, 52], but this view has not been convincingly tested. Instead, Trumbo and McComas[46] found that systematic processing was positively correlated with risk perception, whereas heuristic processing was negatively correlated with risk perception. This same conclusion was reached by Trumbo[51, 52]. In this study, to simplify the model, we examined only systematic processing. According to the noted research and analysis, we derived the following hypotheses:
H3a: There is a significant positive relationship between systematic processing and the surrounding public's expressive and demonstrative behavior to a WTE plant.
H3b: There is a significant positive relationship between systematic processing and the public's risk perception.

2.4 Benefit Perception

Studies have shown that benefit perception is an important factor in determining public attitudes[53-56]. The relationship between benefit perception and public risk response behavior, however, has not been examined. Therefore, in this study, we examined the relationship between benefit perception and risk response for the first time in the scenario of a WTE plant. In the analytical approach to decision making, risk and benefit are two distinct concepts[57]. Although different, a large number of studies have shown that in different risk scenarios, risk and benefit are negatively correlated; that is, activities or technologies judged as high-risk often are seen as offering low benefits and vice versa[43, 57-62]. Therefore, in this study, on the basis of the noted research and analysis, we devised the following hypotheses:
H4a: There is a significant negative relationship between benefit perception and the surrounding public's expressive and demonstrative behavior toward a WTE plant.
H4b: There is a significant negative relationship between benefit perception and risk perception.
In summary, through the previous analysis, we constructed the following theoretical model, as shown in Figure 1.
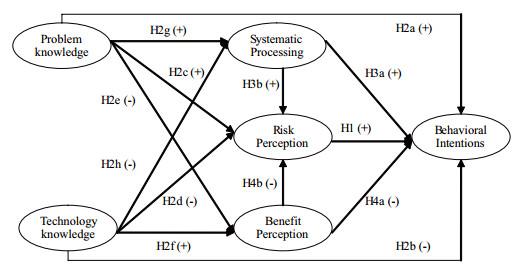
Figure 1 Theoretical model of the public's risk responses to WTE plants

Full size|PPT slide

3 Method

3.1 Sample

In this study, we conducted a random questionnaire survey (January 2020) within three communities in the Torch Development Zone of Zhongshan City (Haipang New Village, Yulong Garden, and Healthy Flower City), all of which are located within 3 km of the Jiufeng WTE Plant in the development zone. We distributed 400 questionnaires; 8 of the 384 responses were invalid, resulting in a total of 376 questionnaires that were useful for analysis (117 from Haipang New Village, 131 from Yulong Garden, and 128 from Healthy Flower City).
The sample of respondents was 201 female (53.5%) 175 male (46.5%). The age of respondents ranged from 18 to 73 years old with a mean age of about 36. Most respondents had lived in the local community for a relatively long time, with an average tenure of about 8.5 years, and 247 respondents reported having children under the age of 16 years, accounting for 65.7% of the total.

3.2 Measures

This study included seven main variables (each of the variables and specific measurement items are shown in Table 1). We measured each of the variables shown in Table 1 with multiple items. Most variables were inspired and adjusted by previous empirical research, but some were partly newly developed. For example, behavioral intentions measures were partly derived from Zeng[13] and partly newly developed. Risk perception measures were inspired by Groothuis and Miller[63]. Benefit perception measures were based on the studies conducted by Kim[56] and Groothuis and Miller[63]. The knowledge scale was partly adapted from Wright[34] and partly newly developed, and the systematic processing scale was adapted from Trumbo[51]. All items were measured on a five-point Likert scale, and the anchors for behavioral intention items and systematic processing items ranged from 1 (not at all likely) to 5 (very great extent). The anchors for the remaining items ranged from 1 (strongly disagree) to 5 (strongly agree).
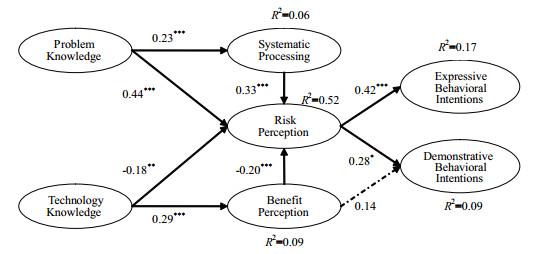
Table 1 Variables and measures included in the questionnaire
Variables Items Measurement References
Behavioral Intentions (BI) BI1 I will hang the protest banners
BI2 I will participate in a signature campaign against WTE plant [13]
BI3 I will appeal to relevant government departments
BI4 I will participate in street demonstrations
Risk Perception (RP) RP1 The WTE plant will be harmful to the health of people who live nearby [63]
RP2 The environment will be polluted by the WTE plant
RP3 The economy will be influenced by the WTE plant
RP4 The WTE plant will decline the real estate value
RP5 The WTE plant will bring inconvenience to the living conditions of the people who locate nearby
Benefit perception (BP) BP1 The WTE plant will create more jobs for the people who live nearby [56], [63]
BP2 The WTE plant will improve the infrastructure of the local communities
BP3 The people who live nearby will get compensation from the construction of WTE plant
Knowledge (KN) KN1 The WTE plant and their surroundings are very dirty and messy [34]
KN2 The WTE plant will generate a lot of smoke and waste water
KN3 The WTE plant will generate lot of toxic gases
KN4 The technology of WTE plant in China is advanced
KN5 WTE plants have been successfully operated for years in China
Systematic processing (SP) SP1 I will make a judgment based on scientific information with a great deal of detail on the WTE plant issue [46]
SP2 I will require statistical information to make a judgment on the WTE plant issue

3.3 Analysis Methods

This study involved many variables, and the relationship among them was complicated. Most of the variables showed multidimensional characteristics, and therefore, the general regression analysis could not fully reveal the complex relationship among these variables. The structural equation model (SEM) is suitable for the analysis of multivariate models, in particular to analyze the causality among latent constructs that cannot be measured directly and accurately. Thus, a large number of studies have applied SEM to examine factors affecting the public's responses to different risk scenarios[53, 55, 64-66]. Therefore, in this study, we employed SEM to examine the factors influencing the public's resistant behaviors toward the scenario of a WTE plant.
The analysis methods of this study generally followed two steps: First, we used SPSS software to conduct an exploratory factor analysis (EFA), and then we used AMOS software to conduct a confirmatory factor analysis (CFA) to evaluate the reliability and validity of the scale. Because EFA cannot calculate the fitting degree of the model very well[67], we needed CFA to improve and evaluate the validity of the scale[68]. Second, after we examined the measurement model and found it to be satisfactory, we conducted a path analysis of the structural model and applied the path coefficient to examine the correlation of the hypothetical model.
In the EFA, we used principal component analysis and Varimax with Kaiser normalization to extract factors with an eigenvalue greater than 1.0. To evaluate the reliability and validity of the scale, we employed the statistics of Cronbach's α coefficient, composite reliability (CR), and average variance extracted (AVE) and adopted the following conditions: Cronbach's coefficient should not be below 0.7[69], CR should be greater than 0.6, and AVE should be greater than 0.5[70].
Finally, we examined the model fit, and the corresponding fitting indices included the chi-square value divided by its degrees of freedom (χ2/df), root mean square error of approximation (RMSEA), goodness of fit index (GFI), incremental fit index (IFI), Tucker-Lewis index (TLI), and comparative fit index (CFI). The criteria for these indices follow: 1) (χ2/df) in the range of 2 to 1 or 3 to 1 indicated an acceptable fit of the model[71]; 2) RMSEA around 0.05 or less indicated a close fit of the model[72]; 3) GFI, IFI, TLI, and CFI above 0.9 indicated a good fit of the model[73-75].

4 Results

4.1 Scale Reliability and Validity

Through factor analysis using SPSS 17.0, the results showed that the Kaiser-Meyer-Olkin (KMO) was 0.770, and the chi-square of the sphericality test of Bartlett was approximately 2623.939 (P=0.000). These results indicated that the scale was suitable for factor analysis. The EFA results are shown in Table 2. Accordingly, we extracted seven factors, and found the loading of each factor was above 0.5. The cumulative explanatory variance of the seven factors was 72.649%, which was sufficiently high to explain the observed correlations. Table 3 shows that behavioral intention contained two factors: Factor 1 included two items (BI1 and BI2), which we named as the expressive behavior, and factor 2 included two items (BI3 and BI4), which we named as the demonstrative behavior. This naming was consistent with the previous theoretical analysis. Moreover, knowledge also contained two factors: Factor 1 included three items (KN1, KN2, and KN3), which we named problem knowledge, and factor 2 included two items (KN4 and KN5), which we named technology knowledge. This naming was also in line with the previous theoretical analysis. The Cronbach's α of each scale was above 0.7 except for the expressive behavior scale, for which the value of the Cronbach's α was 0.696, slightly less than 0.7 but still acceptable.
Table 2 EFA and CFA results of the scale
Variables Items Exploratory Factor Analysis (EFA) Confirmatory Factor Analysis (CFA)
Factor Loadings Variance Explained (%) Cronbach's α Factor Loadings R2 CR AVE
1 2
EBI BI1 .869 8.315 .696 .605 .366 0.724 0.576
BI2 .834 .886 .786
DBI BI3 .880 8.356 .713 .806 .650 0.720 0.564
BI4 .856 .691 .477
RP RP1 .608 15.462 .835 .765 .585 0.835 0.506
RP2 .652 .818 .669
RP3 .761 .635 .403
RP4 .806 .650 .422
RP5 .739 .673 .452
BP BP1 .819 10.264 .718 .644 .415 0.725 0.477
BP2 .800 .857 .734
BP3 .730 .532 .283
PK KN1 .763 11.994 .792 .616 .380 0.806 0.586
KN2 .857 .911 .829
KN3 .816 .741 .549
TK KN4 .857 8.812 .722 .753 .566 0.722 0.565
KN5 .852 .750 .563
SP SP1 .920 9.445 .892 .827 .684 0.898 0.816
SP2 .896 .974 .949
Note: EBI = Expressive Behavioral Intentions, DBI = Demonstrative Behavioral Intentions, RP = Risk Perception, BP = Benefit Perception, PK = Problem Knowledge, TK = Technology Knowledge, SP = Systematic Processing.
Table 3 Means (M), standard deviations (SD), and correlations among variables
Variable M SD 1 2 3 4 5 6 7
1. RP 3.750 .599 1
2. BP 3.239 .651 .241 1
3. PP 3.551 .621 .452 .006 1
4. TP 2.916 .624 .252 .200 .171 1
5. SP 3.876 .705 .423 .154 .223 .080 1
6. EBI 3.379 .586 .303 .123 .121 .053 .209 1
7. DBI 3.321 .567 .236 .108 .079 .012 .121 .066 1
Note: P<0.001, P<0.01, P<0.05.
Then we conducted the CFA using AMOS22.0. The results are presented in Table 3. All of the factor loadings were still above 0.5, and the CR of each scale was above 0.7. The AVE was above 0.5, but the AVE of the benefit perception scale was 0.477, which was slightly less than 0.5 but still acceptable. The model fit indices indicated that the measurement model with seven factors was acceptable (χ2=275.056, df=131, (χ2/df)=2.100, GFI = 0.922, IFI = 0.943, TLI = 0.925, CFI = 0.942, RMSEA = 0.054). Therefore, through this exploratory and confirmatory factor analysis, we found the scale constructed in this study to have satisfactory reliability and validity.

4.2 Correlation Analysis of Variables

The statistical results of means, standard deviations, and bivariate correlations among variables are presented in Table 3. From the mean score of all variables, we found that the public's systematic processing (M=.876) and risk perception (M=3.750) had the highest scores, which indicated that in the scenario of a WTE plant in China, the surrounding public would pay more attention to the possible risk that might be caused by the plant and systematically process this risk information. The mean scores of benefit perception (M=3.239) and technology knowledge (M=2.916) were the lowest, which indicated that the surrounding public knew little about the technology of the plants and did not feel much benefit. The public was more likely to take expressive action (M=3.379), followed by demonstrative action (M=3.321). From the results of the bivariate correlations among variables, we found significant correlations among most variables. Therefore, this study further analyzed and discussed the relationships among these variables.

4.3 Path Analysis of Variables

After confirmatory factor analysis of the measurement model, we conducted the path analysis with a structural equation model using AMOS 22.0 software to create the hypothetical model shown in Figure 1. We applied the maximum likelihood method and the estimated parameters, including the path coefficient (β), the critical ratio of the significant test (t) and the squared multiple correlations (R2). To keep results simple and clear, we omitted the observed variables, error terms, and insignificant paths from the diagram, and the model fit indices were acceptable (χ2=297.212, df=133, (χ2/df)=2.235, GFI = 0.916, IFI = 0.935, TLI = 0.916, CFI = 0.934, RMSEA = 0.057). The results in Figure 2 show that problem knowledge was negatively but not significantly correlated with benefit perception (β=0.10,t=0.16), positively correlated with risk perception (β=0.44,t=7.17), and significantly positively correlated with systematic processing (β=0.23,t=3.71). That is, the more the surrounding public knew about the problem of the WTE plant, the greater risk they perceived, and the more they tended to systematically process the relevant risk information. Thus, our findings supported hypotheses H2c and H2g, but hypothesis H2e was not supported by the data.
Figure 2 Results of public risk response behavior toward WTE plants

Full size|PPT slide

Technology knowledge had a significant positive correlation with benefit perception (β=0.29,t=3.67), a significant negative correlation with risk perception (β=0.18,t=2.99), and a negative but not significant correlation with system processing (β=0.03,t=0.523). That is, when the surrounding public knew more about the technology of the WTE plant, the perceived increased benefit and perceived decreased risk. Thus, our findings supported hypotheses H2d and H2f, but hypothesis H2h was not supported by the data.
Systematic processing was positively correlated with risk perception (β=0.33,t=6.61); that is, in the case of WTE plant, the more the public systematically processed the risk information, the higher the perceived risk would be. Thus, our findings supported hypothesis H3b.
Benefit perception was negatively correlated with risk perception (β=0.20,t=3.49), that is, the more benefits the public perceived, the less risk they would perceive. Thus, our findings supported hypothesis H4b.
We found a significant positive correlation between risk perception and expressive behavior intention (β=0.42,t=3.61) and demonstrative behavior intention (β=0.28,t=2.45); that is, in the case of a WTE plant, people with higher levels of risk perception usually presented higher levels of intention to resist. In contrast, we did not find a significant correlation between other variables and the public's behavioral intentions. Thus, our findings supported hypothesis H1, although hypotheses H4a, H2a, H2b, and H3a were not supported by the data.

5 Discussion and Implications

5.1 Results

This study empirically examined the surrounding public's risk response to the WTE plant in China, in particular the factors that influenced the public's resistant behavioral intentions, such as knowledge, risk perception, benefit perception, and systematic information processing. In this section, we discuss the main results of this study and provide necessary explanations for these results. We then discuss the practical implications and the limitations of this study.
The results of this study identified that risk perception was an important factor affecting the resistant behavioral intentions of the surrounding public. People with higher levels of perceived risk usually presented higher levels of intention to resist. In contrast, other factors did not have a significant correlation with the public's resistant behavioral intentions. The relationship between benefit perception and demonstrative behavioral intention should be discussed carefully, however. The results showed that when the public perceived that more benefit would be brought by the construction of a WTE plant, they were less likely to take actions of demonstration (β=0.14,t=1.81). The reason why the relationship between benefit perception and demonstrative behavioral intention was not significant may have been that the sample size was too small; that is, we could not ignore the influence of benefit perception on the public's response toward a WTE plant. Nevertheless, risk perception was still a better indicator than benefit perception for predicting the surrounding public's resistant behavioral responses toward a WTE plant.
This study also paid particular attention to the effects of knowledge on other variables. The relationship between knowledge and risk perception has been examined extensively in previous studies, but the results have been inconsistent for several reasons, including the following: 1) Interpretations and measures of knowledge vary. Some studies have paid attention only to problem-related knowledge[34], some have focused on the knowledge of personnel and technology[42], and others have measured only the public's subjective knowledge in general without specifically referring to a specific aspect of knowledge[36]. 2) Different risk scenarios. A number of studies have examined nuclear hazards[21, 42, 59], natural hazards[22, 26, 31, 35], and product crises[27, 36]. According to previous research, this study measured the public's problem and technology knowledge pertaining to the WTE plant. The results showed that problem knowledge had a significant positive impact on the public's risk perception, and technology knowledge had a significant negative effect on the public's risk perception. That is, in the scenario of the WTE plant, when the public focused more on the actual problem (e.g., the amount of smoke and toxic gases generated by WTE plants), they perceived more risk. When the public paid more attention to the technology aspects (e.g., advanced technology introduced by WTE plant, skilled technicians, management and operation experience), they perceived less risk. Problem knowledge had a greater and more significant impact on risk perception than that of technology knowledge, which indicated that problem knowledge was a better indicator in predicting the public's risk perception. For the relationship between knowledge and benefit perception, the results showed that problem knowledge had a negative, but insignificant, impact on the public's benefit perception. Technology knowledge had a significant positive effect on the public's benefit perception, which indicated that when the public paid more attention to the technology aspects, they perceived more benefit. Hence, technology knowledge would be a better indicator in predicting the public's benefit perception. The results of this study also did not find a significant correlation between technology knowledge and systematic processing but did find a significant positive correlation between problem knowledge and systematic processing. A possible explanation for this result is that when the public knew more about technology, they may have processed the information heuristically instead of spending too much time thinking about it and making great efforts to collect and process related information (e.g., take the expert's opinions and suggestions directly, or make a risk judgment base on past experience). When the public focused more on the problem of the WTE plant, they required much more information, spent more time, and exerted a great deal of effort searching for more risk information and analyzing it carefully, which further increased their risk judgment. For the relationship between knowledge and the surrounding public's resistant behavioral intention, the results of this study showed that there was no significant correlation between them, which was inconsistent with most of the previous research. Therefore, in this study, at least in the scenario of the WTE plant, knowledge did not directly influence the public's intention to resist. However, the process of psychological cognition, including risk perception, indirectly affected their resistant behavioral intentions. In addition, the relationship between systematic processing and the public responses was not tested in this study. The results of this study showed that systematic processing also affected the public responses indirectly through risk perception.
Most previous studies have asserted that there was a significant negative relationship between benefit perception and risk perception, which was also tested in this study. The effect of benefit perception on risk perception was weakened when systematic processing was added into the model in the path analysis. The impact of system processing on risk perception was greater than that of benefit perception. That is, systematic processing was better in explaining the risk judgment of the public than benefit perception, which was consistent with the HSIP model. Therefore, in the scenario of the WTE plant, employment and other economic compensation relating to benefit perception would affect the public's judgment of risk. In addition, what was important in affecting their risk judgment was the kind of information the public had accessed and how they dealt with it.

5.2 Practical Implications

The results of this study showed that risk perception was a critical factor affecting public risk responses. Although insignificant, benefit perception was still an important factor that had to be considered when affecting public behavior. Hence, from a decision-making perspective, if the surrounding public's resistance to a WTE plant is based on personal "risk-benefit" calculations, then the policy aimed at changing net results should pay more attention to the "risk and loss" part of the calculation. Therefore, an effective policy tool could be to make the public more aware of the technical knowledge related to the WTE plant, such as regularly inviting the surrounding public to visit the WTE plant, educating and popularizing the relevant technical knowledge on the spot, and increasing public awareness of the technology, management, and operation of the WTE plant.
The influence of benefit on public resistant responses was relatively small but not unimportant. An increase in perceived benefit could alleviate, to a certain extent, the intention of the public's resistant behavior. Therefore, a practical policy tool would use incentives, including a direct monetary form or an indirect non-monetary welfare form, such as employment, tax mitigation, perfection of the surrounding infrastructure, and beautification of the environment.

5.3 Limitations

This study systematically examined the factors affecting the surrounding public's risk response to the WTE plant in China and identified several empirical conclusions. Some of the research hypotheses in this study were not tested, however, which may have resulted from the inaccurate measures of variables or insufficient sample size. The factors affecting public responses were complicated, and because of space limitations, this study did not consider other possible factors. For example, the HSIP model argues that the public will make a risk judgment heuristically or systematically. This study focused only on systematic processing, without examining the effects of the heuristic processing mode, which is another important factor that has been demonstrated by previous studies[46]. Hence, these matters should be further discussed and examined in the future.

References

1
Lin P Y, Lai S P, Wang M C, et al. Environmental health risks perception, attitude, and avoidance behaviour toward municipal solid waste incinerator. International Journal of Environmental Health Research, 2018, 28(3): 1- 8.
2
Child D. WTE site selection: A successful case study. Solid waste and Power, 1989, 3(4): 50- 52.
3
Furuseth O J, O'Callaghan J. Community response to a municipal waste incinerator: NIMBY or neighbor?. Landscape & Urban Planning, 1991, 21(3): 163- 171.
4
Himmelberger J J, Ratick S J, White A L. Compensation for risks: Host community benefits in siting locally unwanted facilities. Environmental Management, 1991, 15(5): 647- 658.
5
Portney K E. Allaying the NIMBY syndrome: The potential for compensation in hazardous waste treatment facility siting. Hazardous Waste, 1984, 1(3): 411- 421.
6
Kunreuther H, Easterling D. The role of compensation in siting hazardous facilities. Journal of Policy Analysis & Management, 1996, 15(4): 601- 622.
7
Gregory R, Kunreuther H, Easterling D, et al. Incentives policies to site hazardous waste facilities. Risk Analysis, 1991, 11(4): 667- 675.
8
Yang M. How to mitigate environmental group events?. South Reviews, 2008,(3): 18- 19.
9
Wang K M, Zhong Y. An empirical study of core issues of NIMBY movement in China: Based on a public opinion survey. Journal of Shanghai Jiaotong University (Philosophy and Social Sciences), 2014, 22(1): 23- 33.
10
Lazarus R S. Psychological stress and the coping process. New York, NY: McGraw-Hill, 1966.
11
Lazarus R S, Folkman S. Stress, appraisal and coping. New York, NY: Springer-Verlag, 1984.
12
Lindell M K, Perry R W. The protective action decision model: Theoretical modifications and additional evidence. Risk Analysis, 2012, 32(4): 616- 632.
13
Zeng J. Public's risk reponses-behavior and information communication research in the situation of nuclear power plants construction. Anhui: University of Science and Technology of China, 2017 (in Chinese).
14
Kollmuss A, Agyeman J. Mind the Gap: Why do people act environmentally and what are the barriers to pro-environmental behavior?. Environmental Education Research, 2002, 8(3): 239- 260.
15
Gong W J. A gender-based comparison of Chinese urban residents' environmentally friendly behaviors. Collection of Women's Studies, 2008, 8(6): 11- 17.
16
Shriver T E, Webb G R. Rethinking the scope of environmental injustice: Perceptions of health hazards in a rural native American community exposed to carbon black. Rural Sociology, 2009, 74(2): 270- 292.
17
Luo Y J. Environment protest of rural industrial pollution: A case study. Academia Bimestris, 2010,(2): 91- 97.
18
Gattinara P C, Froio C. Who owns Italian politics?. Arena Magazine, 2013,(122): 26- 29.
19
Slovic P. Perception of risk. Science, 1987, 236(4799): 280- 285.
20
Sjoberg L. Risk perception in Western Europe. Seminar on Assessment of Risk in a National and International, 1999, 28(6): 543- 549.
21
Mileti D S, Peek L. The social psychology of public response to warnings of a nuclear power plant accident. Journal of Hazardous Materials, 2000, 75(2): 181- 194.
22
Wu H C, Lindell M K, Prater C S. Strike probability judgments and protective action recommendations in a dynamic hurricane tracking task. Natural Hazards, 2015, 79(1): 355- 380.
23
Brewer N T, Weinstein N D, Cuite C L, et al. Risk perceptions and their relation to risk behavior. Annals of Behavioral Medicine, 2004, 27(2): 125- 130.
24
Brewer N T, Chapman G B, Gibbons F X, et al. Meta-analysis of the relationship between risk perception and health behavior: The example of vaccination. Health Psychology, 2007, 26(2): 136- 145.
25
Lindell M K, Arlikatti S, Prater C S. Why people do what they do to protect against earthquake risk: Perceptions of hazard adjustment attributes. Risk Analysis, 2009, 29(8): 1072- 1088.
26
Ge Y, Peacock W G, Lindell M K. Florida households' expected responses to hurricane hazard mitigation incentives. Risk Analysis, 2011, 31(10): 1676- 1691.
27
Feng T, Keller L R, Wu P, et al. An empirical study of the toxic capsule crisis in China: Risk perceptions and behavioral responses. Risk Analysis, 2014, 34(4): 698- 710.
28
Xu J, Tan H. Differentiated effects of risk perception and causal attribution on public behavioral responses to air pollution: A segmentation analysis. Journal of Environmental Psychology, 2019, 65, 101335.
29
Cahyanto I P, Liu L B. Risk perception, media exposure, and visitor's behavior responses to florida red tide. Journal of Travel & Tourism Marketing, 2020, 37(4): 447- 459.
30
Morss R E, Lazrus H, Bostrom A, et al. The influence of cultural worldviews on people's responses to hurricane risks and threat information. Journal of Risk Research, 2020,(4): 1- 30.
31
Perry R W, Lindell M K. Volcanic risk perception and adjustment in a multi-hazard environment. Journal of Volcanology & Geothermal Research, 2008, 172(3-4): 170- 178.
32
Johnson B B. Advancing understanding of knowledge's role in lay risk perception. Risk, Issues in Health & Safety, 1993, 4(3): 189- 212.
33
Lindell M K, Perry R W. Communicating environmental risk in multiethnic communities. Thousand Oaks, CA: Sage, 2004.
34
Wright S A. Citizen information levels and grassroots opposition to new hazardous waste sites: Are nimbyists informed?. Waste Management, 1993, 13(3): 253- 259.
35
Lindell M K, Whitney D J. Correlates of household seismic hazard adjustment adoption. Risk Analysis, 2000, 20(1): 13- 26.
36
Wei J, Zhao M, Wang F, et al. An empirical study of the Volkswagen crisis in China: Customers' information processing and behavioral intentions. Risk Analysis, 2016, 36(1): 114- 129.
37
Weinstein N D. Effects of personal experience on self-protective behavior. Psychological Bulletin, 1989, 105(1): 31- 50.
38
Faupel C E, Styles S P. Disaster education, household preparedness, and stress responses following hurricane hugo. Environment and Behavior, 1993, 25(2): 228- 249.
39
Klerck D, Sweeney J C. The effect of knowledge types on consumer-perceived risk and adoption of genetically modified foods. Psychology & Marketing, 2007, 24(2): 171- 193.
40
Wallquist L, Visschers V H M, Siegrist M. Impact of knowledge and misconceptions on benefit and risk perception of CCS. Environmental Science & Technology, 2010, 44(17): 6557- 6562.
41
Harris J, Blair E A. Functional compatibility risk and consumer preference for product bundles. Journal of the Academy of Marketing Science, 2006, 34(1): 19- 26.
42
Jenkins-Smith H C, Silva C L, Nowlin M C, et al. Reversing nuclear opposition: Evolving public acceptance of a permanent nuclear waste disposal facility. Risk Analysis, 2011, 31(4): 629- 644.
43
McDaniels T L, Axelrod L J, Cavanagh N S, et al. Perception of ecological risk to water environments. Risk Analysis, 1997, 17(3): 341- 352.
44
Peacock W G, Brody S D, Highfield W. Hurricane risk perceptions among Florida's single family homeowners. Landscape and Urban Planning, 2005, 73(2): 120- 135.
45
Eagly A H, Chaiken S. The psychology of attitudes. Harcourt Brece: San Diego, 1993.
46
Trumbo C W, McComas K A. The function of credibility in information processing for risk perception. Risk Analysis, 2003, 23(2): 343- 353.
47
Kahlor L A, Dunwoody S, Griffin R J, et al. Studying heuristic systematic processing of risk communication. Risk Analysis, 2003, 23(2): 355- 368.
48
Chaiken S, Liberman A, Eagly A H. Heuristic and systematic information processing within and beyond the persuasion context. Uleman J S. Unintended Thought. NewYork: Guilford Press, 1989: 212- 252.
49
Griffin R J, Dunwoody S, Neuwirth K. Proposed model of the relationship of risk information seeking and processing to the development of preventive behaviors. Environmental Research, 1999, 80(2): 230- 245.
50
Hovick S, Freimuth V S, Johnson-Turbes A, et al. Multiple health risk perception and information processing among african americans and whites living in poverty. Risk Analysis, 2011, 31(11): 1789- 1799.
51
Trumbo C W. Heuristic-systematic information processing and risk judgment. Risk Analysis, 1999, 19(3): 391- 400.
52
Trumbo C W. Information processing and risk perception: An adaptation of the heuristic-systematic model. Journal of Communication, 2002, 52(2): 367- 382.
53
Siegrist M A. Causal model explaining the perception and acceptance of gene technology. Journal of Applied Social Psychology, 1999, 29(10): 2093- 2106.
54
Siegrist M. The influence of trust and perceptions of risks and benefits on the acceptance of gene technology. Risk Analysis, 2000, 20(2): 195- 204.
55
Tanaka Y. Major psychological factors affecting acceptance of gene recombination technology. Risk Analysis, 2004, 24(6): 1575- 1583.
56
Kim D S. Determinants of public opposition to siting waste facilities in Korean rural communities. Korean Journal of Sociology, 2009, 43(6): 25- 43.
57
Alhakami A S, Slovic P. A psychological study of the inverse relationship between perceived risk and perceived benefit. Risk Analysis, 1994, 14(6): 1085- 1096.
58
Fischhoff B, Slovic P, Lichtenstein S, et al. How safe is safe enough? A psychometric study of attitudes towards technological risks and benefits. Policy Sciences, 1978, 9(2): 127- 152.
59
Gardner G T, Tiemann A R, Gould L C, et al. Risk and benefit perceptions, acceptability judgments, and self-reported actions toward nuclear power. The Journal of Social Psychology, 1982, 116(2): 179- 197.
60
Baird B N R. Tolerance for environmental health risks: The influence of knowledge, benefits, voluntariness, and environmental attitudes. Risk Analysis, 1987, 6(4): 425- 435.
61
Slovic P, Kraus N N, Lappe H, et al. Risk perception of prescription drugs: Report on a survey in Canada. Canadian Journal of Public Health, 1991, 82(3): S15- S20.
62
Finucane M L, Alhakami A, Slovic P, et al. The affect heuristic in judgments of risks and benefits. Journal of Behavioral Decision Making, 2000, 13(1): 1- 17.
63
Groothuis P A, Miller G. Locating hazardous waste facilities: The influence of NIMBY beliefs. American Journal of Economics & Sociology, 1994, 53(3): 335- 346.
64
Allum N. An empirical test of competing theories of hazard-related trust: The case of GM food. Risk Analysis, 2007, 27(4): 935- 946.
65
Kuttschreuter M. Psychological determinants of reactions to food risk messages. Risk Analysis, 2006, 26(4): 1045- 1057.
66
Prati G, Pietrantoni L, Zani B. A social cognitive model of pandemic influenza H1N1 risk perception and recommended behaviors in Italy. Risk Analysis, 2011, 31(4): 645- 656.
67
Huurne E T, Gutteling J. Information needs and risk perception as predictors of risk information seeking. Journal of Risk Research, 2008, 11(7): 847- 862.
68
Gerbing D W, Anderson J C. An updated paradigm for scale development incorporating unidimensionality and its assessment. Journal of Marketing Research, 1988, 25(2): 186- 192.
69
Nunnally J C. Psychometric theory. 2nd ed New York: McGraw-Hill, 1978.
70
Fornell C, Larcker D F. Evaluating structural equation models with unobservable variables and measurement error. Journal of Marketing Research, 1981, 18(1): 39- 50.
71
Carmines E G, McIver J P. Analyzing models with unobserved variables. Bohrnstedt G W, Borgatta E F. Social measurement: Current issues. Beverly Hills: Sage, 1981: 65-115.
72
Browne M W, Cudeck R. Alternative ways of assessing model fit. Bollen K A, Long J S. Testing structural equation models. Newbury Park, CA: Sage, 1993: 136-162.
73
Tanaka J S, Huba G J. A fit index for covariance structure models under arbitrary GLS estimation. British Journal of Mathematical and Statistical Psychology, 1985,(38): 197- 201.
74
Anderson J C, Gerbing D W. Structural equation modeling in practice: A review and recommended two-step approach. Psychological Bulletin, 1988, 103(3): 411- 423.
75
Hu L T, Bentler P M. Evaluating model fit. Hoyle R H. Structural equation modelling: Concepts, issues and applications. Thousand Oaks, CA: Sage, 1995: 76-99.

Acknowledgments

We thank LetPub (www.letpub.com) for its linguistic assistance during the preparation of this manuscript.

PDF(252 KB)

405

Accesses

0

Citation

Detail

Sections
Recommended

/