ISSN 2512-6660 (Online) ISSN 1478-9906 (Print)
CN 10-1192/N
CN 10-1192/N
| Year | Data | GM | CFGM | NGBM | CFNGBM | CFNGBM |
| 2013 | 13027.60 | 13027.6000 | 13027.6000 | 13027.6000 | 13027.6000 | 13027.6000 |
| 2014 | 14623.78 | 14660.3057 | 14474.6793 | 14419.7501 | 14460.8603 | 14473.9196 |
| 2015 | 16040.54 | 16188.5170 | 16284.5387 | 16257.7120 | 16294.1753 | 16230.6969 |
| 2016 | 18023.04 | 17876.0313 | 18044.2505 | 18019.4259 | 18049.5199 | 17979.0338 |
| 2017 | 20066.29 | 19739.4544 | 19828.2366 | 19804.8763 | 19826.8504 | 19771.5042 |
| 2018 | 21588.80 | 21797.1235 | 21674.0857 | 21658.1397 | 21670.1344 | 21639.4848 |
| 2019 | 23605.77 | 24069.2869 | 23605.7700 | 23605.7697 | 23605.7700 | 23604.7394 |
| 2020 | 25002.79 | 26578.3039 | 25641.2743 | 25667.3082 | 25653.1080 | 25684.5408 |
| 2021 | 27894.02 | 29348.8645 | 27795.7346 | 27859.2019 | 27828.3720 | 27894.0199 |
| MAPE | 0.9163 | 0.8480 | 0.8786 | 0.8824 | 0.8316 | |
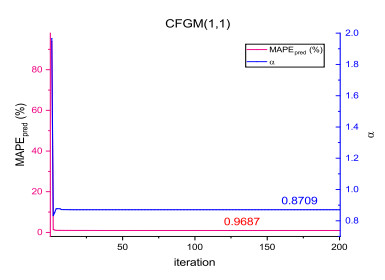
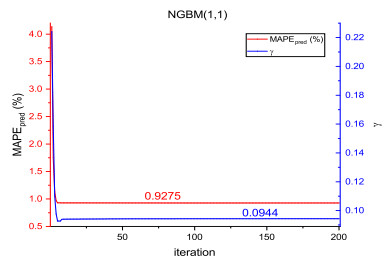
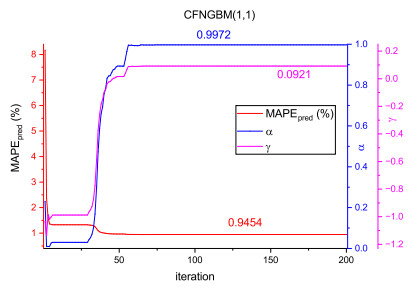
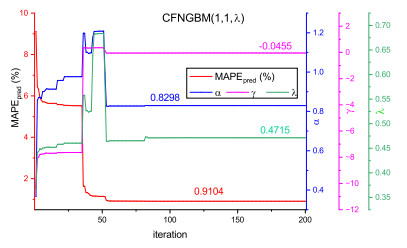
| MAPE | 4.4935 | 0.9687 | 0.9275 | 0.9454 | 0.9104 | |
| MAPE | 2.2578 | 0.8932 | 0.8970 | 0.9061 | 0.8612 | |