ISSN 2512-6660 (Online) ISSN 1478-9906 (Print)
CN 10-1192/N
CN 10-1192/N
| Year | Data | GM | CFGM | NGBM | CFNGBM | CFNGBM |
| 2013 | 915.11 | 915.1100 | 915.1100 | 915.1100 | 915.1100 | 915.1100 |
| 2014 | 973.86 | 948.3987 | 945.7211 | 942.7257 | 971.0887 | 980.0283 |
| 2015 | 1018.00 | 1025.1867 | 1027.7195 | 1026.6834 | 1010.5014 | 1028.1554 |
| 2016 | 1086.43 | 1108.1919 | 1111.6211 | 1111.2706 | 1100.5145 | 1117.2273 |
| 2017 | 1182.11 | 1197.9176 | 1199.2976 | 1199.2222 | 1199.1230 | 1213.0931 |
| 2018 | 1318.83 | 1294.9081 | 1291.7955 | 1291.8225 | 1299.8282 | 1310.4811 |
| 2019 | 1433.30 | 1399.7515 | 1389.8733 | 1389.9212 | 1401.1927 | 1408.3254 |
| 2020 | 1465.88 | 1513.0836 | 1494.1747 | 1494.2055 | 1502.9811 | 1506.5395 |
| 2021 | 1605.30 | 1635.5918 | 1605.3000 | 1605.2999 | 1605.3000 | 1605.3000 |
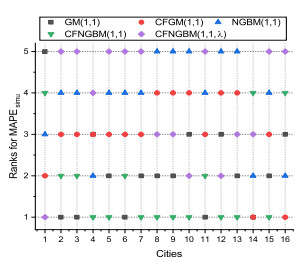
| MAPE | 1.6949 | 1.9333 | 1.9664 | 1.0395 | 1.5439 | |
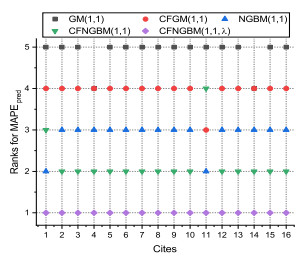
| MAPE | 2.4826 | 1.6534 | 1.6529 | 1.5904 | 1.5054 | |
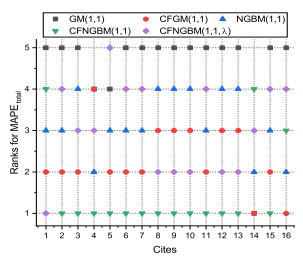
| MAPE | 1.9903 | 1.8284 | 1.8488 | 1.2461 | 1.5295 | |