ISSN 2512-6660 (Online) ISSN 1478-9906 (Print)
CN 10-1192/N
CN 10-1192/N
| Year | Data | GM | CFGM | NGBM | CFNGBM | CFNGBM |
| 2013 | 1159.16 | 1159.1600 | 1159.1600 | 1159.1600 | 1159.1600 | 1159.1600 |
| 2014 | 1272.12 | 1244.4203 | 1229.2475 | 1212.6902 | 1257.0795 | 1255.4409 |
| 2015 | 1366.56 | 1377.3405 | 1390.5689 | 1383.1476 | 1373.5877 | 1426.2945 |
| 2016 | 1495.49 | 1524.4584 | 1543.5620 | 1540.4179 | 1531.4351 | 1584.8349 |
| 2017 | 1697.58 | 1687.2904 | 1695.7064 | 1694.8231 | 1694.8179 | 1737.7772 |
| 2018 | 1879.53 | 1867.5149 | 1850.6647 | 1850.9296 | 1858.7678 | 1888.9372 |
| 2019 | 2041.49 | 2066.9897 | 2010.6590 | 2011.3416 | 2022.6662 | 2040.6604 |
| 2020 | 2117.80 | 2287.7711 | 2177.2576 | 2177.8171 | 2186.8134 | 2194.5292 |
| 2021 | 2351.70 | 2532.1347 | 2351.7000 | 2351.6988 | 2351.7000 | 2351.7000 |
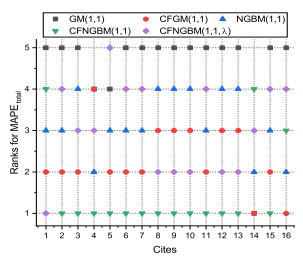
| MAPE | 1.2298 | 1.9975 | 2.1148 | 1.0735 | 2.9050 | |
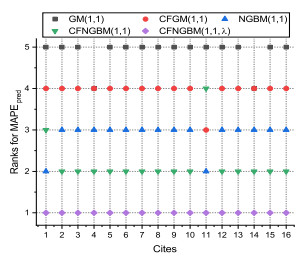
| MAPE | 5.6491 | 1.4392 | 1.4369 | 1.3936 | 1.2212 | |
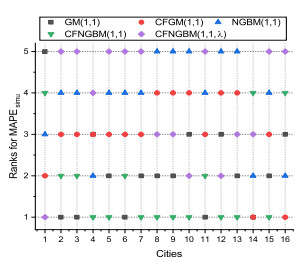
| MAPE | 2.8870 | 1.7882 | 1.8606 | 1.1935 | 2.2736 | |