ISSN 2512-6660 (Online) ISSN 1478-9906 (Print)
CN 10-1192/N
CN 10-1192/N
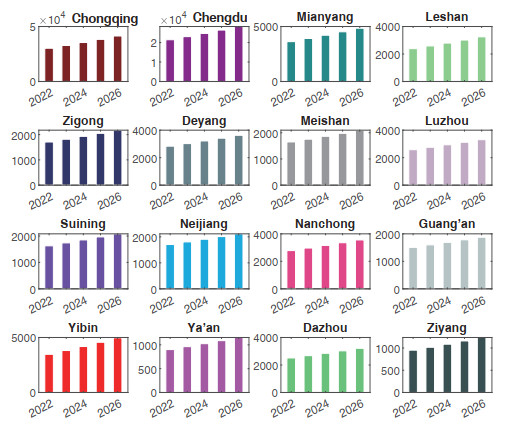
| Chongqing | Chengdu | Mianyang | Leshan | Zigong | Deyang | Meishan | Luzhou | |
| 2022 | 8.4367 | 7.6514 | 8.2031 | 8.4250 | 6.5700 | 6.8074 | 6.5420 | 7.2650 |
| 2023 | 8.3019 | 7.3980 | 7.8842 | 8.2245 | 6.4129 | 6.5805 | 6.3809 | 6.8679 |
| 2024 | 8.1900 | 7.1899 | 7.6217 | 8.0485 | 6.2843 | 6.3943 | 6.2488 | 6.5302 |
| 2025 | 8.0955 | 7.0160 | 7.4019 | 7.8928 | 6.1770 | 6.2388 | 6.1386 | 6.2400 |
| 2026 | 8.0147 | 6.8686 | 7.2152 | 7.7540 | 6.0863 | 6.1071 | 6.0453 | 5.9879 |
| mean | 8.2078 | 7.2248 | 7.6652 | 8.0689 | 6.3061 | 6.4256 | 6.2711 | 6.5782 |
| Suining | Neijiang | Nanchong | Guang'an | Yibin | Ya'an | Dazhou | Ziyang | |
| 2022 | 7.2139 | 6.2011 | 6.9112 | 6.3806 | 10.3131 | 7.1325 | 6.8621 | 6.9146 |
| 2023 | 6.8057 | 5.8994 | 6.6369 | 6.0269 | 9.8986 | 6.7906 | 6.6186 | 6.8526 |
| 2024 | 6.4593 | 5.6403 | 6.4119 | 5.7244 | 9.5423 | 6.4956 | 6.4167 | 6.7900 |
| 2025 | 6.1620 | 5.4157 | 6.2243 | 5.4632 | 9.2325 | 6.2392 | 6.2467 | 6.7282 |
| 2026 | 5.9041 | 5.2195 | 6.0653 | 5.2356 | 8.9603 | 6.0144 | 6.1015 | 6.6678 |
| mean | 6.5090 | 5.6752 | 6.4499 | 5.7661 | 9.5893 | 6.5345 | 6.4491 | 6.7906 |