×
模态框(Modal)标题
在这里添加一些文本
关闭
关闭
提交更改
取消
确定并提交
×
模态框(Modal)标题
×
中国科学院数学与系统科学研究院期刊网
ISSN 1439-8516 CN 11-2039/O1
Toggle navigation
AMS
Home
About Journal
Editorial Board
Instruction
Subscription
Download
Contact Us
图/表 详细信息
A Nonlinear Grey Bernoulli Model with Conformable Fractional-Order Accumulation and Its Application to the Gross Regional Product in the Cheng-Yu Area
Wenqing WU, Xin MA, Bo ZENG, Yuanyuan ZHANG
系统科学与信息学报(英文), 2024, 12(
2
): 245-273. DOI:
10.21078/JSSI-2023-0119
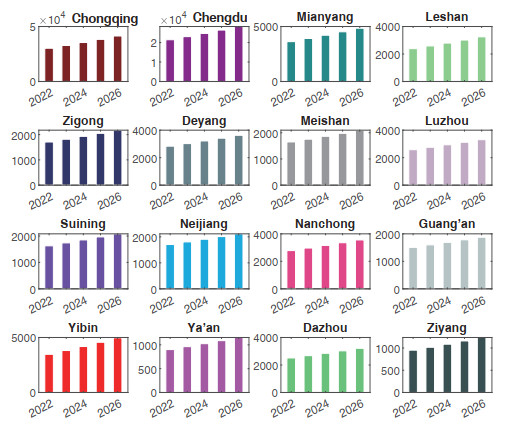
Figure 12
The plots of the gross regional product of all cities in Cheng-Yu area by the CFNGBM
$ (1, 1, \lambda) $
model in the next several years
本文的其它图/表
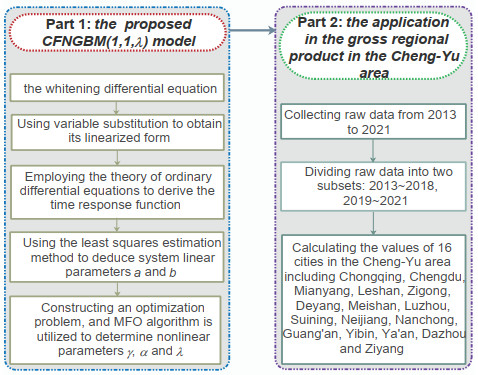
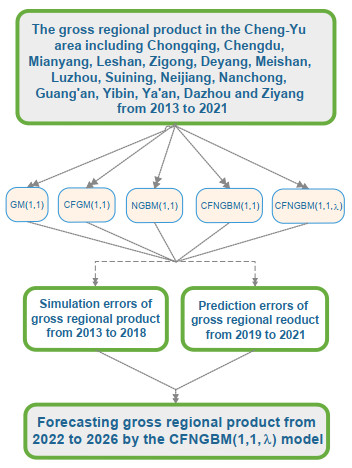
Figure 1
The main contents of the study
Table 1
Abbreviations for various grey forecasting models
Table 2
Notations for different variables
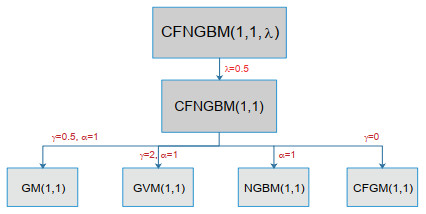
Figure 2
The relationship among the CFNGBM
$ (1, 1, \lambda) $
, CFNGBM
$ (1, 1) $
, CFGM
$ (1, 1) $
, NGBM
$ (1, 1) $
, GVM(1, 1) and GM
$ (1, 1) $
models
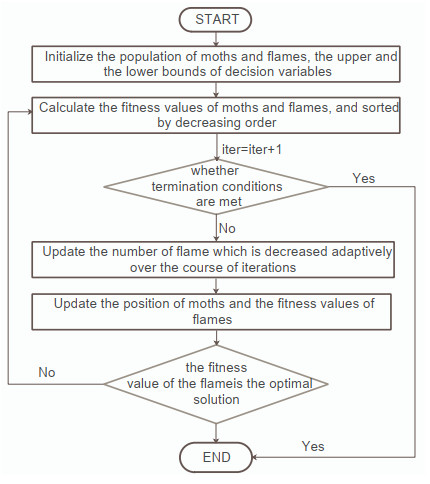
Figure 3
The general framework of the MFO algorithm
Table 3
Raw data of gross regional product in the Cheng-Yu area (million yuan)
Figure 4
The numerical design of the application in the gross regional product
Table 4
The minimum MAPE
$ _{\rm pred} $
and corresponding nonlinear parameters of grey models
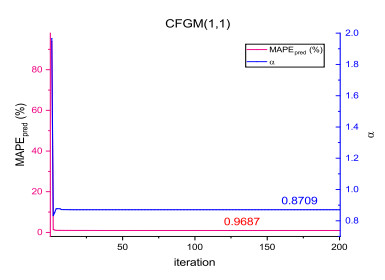
Figure 5
The convergence curve of MAPE
$ _{\rm pred} $
and
$ \alpha $
of the CFGM
$ (1, 1) $
model in Chongqing case
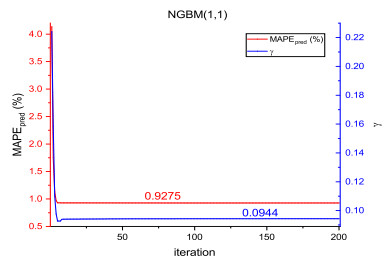
Figure 6
The convergence curve of MAPE
$ _{\rm pred} $
and
$ \gamma $
of the NGBM
$ (1, 1) $
model in Chongqing case
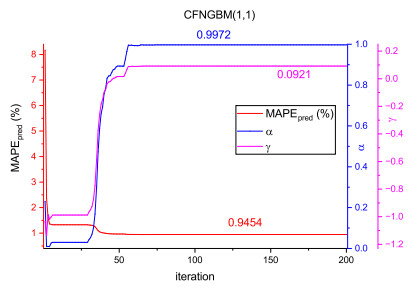
Figure 7
The convergence curve of MAPE
$ _{\rm pred} $
,
$ \alpha $
and
$ \gamma $
of the CFNGBM
$ (1, 1) $
model in Chongqing case
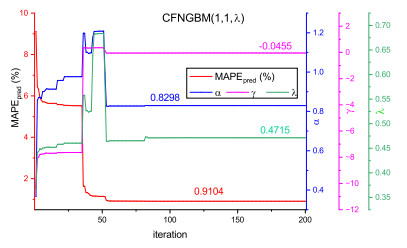
Figure 8
The convergence curve of MAPE
$ _{\rm pred} $
,
$ \alpha $
,
$ \gamma $
and
$ \lambda $
of the CFNGBM
$ (1, 1, \lambda) $
model in Chongqing case
Table 5
The results of the gross regional product of Chongqing by the GM
$ (1, 1) $
, CFGM
$ (1, 1) $
, NGBM
$ (1, 1) $
, CFNGBM
$ (1, 1) $
and CFNGBM
$ (1, 1, \lambda) $
models
Table 6
The results of the gross regional product of Chengdu by the GM
$ (1, 1) $
, CFGM
$ (1, 1) $
, NGBM
$ (1, 1) $
, CFNGBM
$ (1, 1) $
and CFNGBM
$ (1, 1, \lambda) $
models
Table 7
The results of the gross regional product of Mianyang by the GM
$ (1, 1) $
, CFGM
$ (1, 1) $
, NGBM
$ (1, 1) $
, CFNGBM
$ (1, 1) $
and CFNGBM
$ (1, 1, \lambda) $
models
Table 8
The results of the gross regional product of Leshan by the GM
$(1, 1)$
, CFGM
$(1, 1)$
, NGBM
$(1, 1)$
and CFNGBM
$(1, 1)$
models
Table 9
The results of the gross regional product of Zigong by the GM
$ (1, 1) $
, CFGM
$ (1, 1) $
, NGBM
$ (1, 1) $
, CFNGBM
$ (1, 1) $
and CFNGBM
$ (1, 1, \lambda) $
models
Table 10
The results of the gross regional product of Deyang by the GM
$(1, 1)$
, CFGM
$(1, 1)$
, NGBM
$(1, 1)$
, CFNGBM
$(1, 1)$
and CFNGBM
$(1, 1, \lambda)$
models
Table 11
The results of the gross regional product of Meishan by the GM
$(1, 1)$
, CFGM
$(1, 1)$
, NGBM
$(1, 1)$
, CFNGBM
$(1, 1)$
and CFNGBM
$(1, 1, \lambda)$
models
Table 12
The results of the gross regional product of Luzhou by the GM
$ (1, 1) $
, CFGM
$ (1, 1) $
, NGBM
$ (1, 1) $
, CFNGBM
$ (1, 1) $
and CFNGBM
$ (1, 1, \lambda) $
models
Table 13
The results of the gross regional product of Suining by the GM
$(1,1)$
, CFGM
$(1,1)$
, NGBM
$(1,1)$
, CFNGBM
$(1,1)$
and CFNGBM
$(1,1,\lambda)$
models
Table 14
The results of the gross regional product of Neijiang by the GM
$(1, 1)$
, CFGM
$(1, 1)$
, NGBM
$(1, 1)$
, CFNGBM
$(1, 1)$
and CFNGBM
$(1, 1, \lambda)$
models
Table 15
The results of the gross regional product of Nanchong by the GM
$(1,1)$
, CFGM
$(1,1)$
, NGBM
$(1,1)$
, CFNGBM
$(1,1)$
and CFNGBM
$(1,1,\lambda)$
models
Table 16
The results of the gross regional product of Guang'an by the GM
$(1,1)$
, CFGM
$(1,1)$
, NGBM
$(1,1)$
, CFNGBM
$(1,1)$
and CFNGBM
$(1,1,\lambda)$
models
Table 17
The results of the gross regional product of Yibin by the GM
$(1, 1)$
, CFGM
$(1, 1)$
, NGBM
$(1, 1)$
, CFNGBM
$(1, 1)$
and CFNGBM
$(1, 1, \lambda)$
models.
Table 18
The results of the gross regional product of Ya'an by the GM
$(1, 1)$
, CFGM
$(1, 1)$
, NGBM
$(1, 1)$
, CFNGBM
$(1, 1)$
and CFNGBM
$(1, 1, \lambda)$
models
Table 19
The results of the gross regional product of Dazhou by the GM
$(1, 1)$
, CFGM
$(1, 1)$
, NGBM
$(1, 1)$
, CFNGBM
$(1, 1)$
and CFNGBM
$(1, 1, \lambda)$
models
Table 20
The results of the gross regional product of Ziyang by the GM
$(1, 1)$
, CFGM
$(1, 1)$
, NGBM
$(1, 1)$
, CFNGBM
$(1, 1)$
and CFNGBM
$(1, 1, \lambda)$
models
Table 21
Summary of ranks for MAPE
$_{\rm simu} $
of the GM
$ (1, 1) $
, CFGM
$ (1, 1) $
, NGBM
$ (1, 1) $
, CFNGBM
$ (1, 1) $
and CFNGBM
$ (1, 1, \lambda) $
models in all cities
Table 22
Summary of ranks for MAPE
$ _{\rm pred} $
of the GM
$ (1, 1) $
, CFGM
$ (1, 1) $
, NGBM
$ (1, 1) $
, CFNGBM
$ (1, 1) $
and CFNGBM
$ (1, 1, \lambda) $
models in all cities
Table 23
Summary of ranks for MAPE
$ _{\rm total} $
of the GM
$ (1, 1) $
, CFGM
$ (1, 1) $
, NGBM
$ (1, 1) $
, CFNGBM
$ (1, 1) $
and CFNGBM
$ (1, 1, \lambda) $
models in all cities
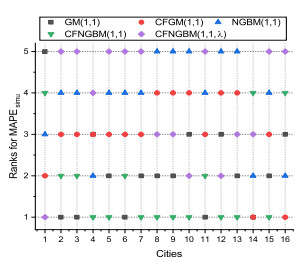
Figure 9
Summary of ranks for MAPE
$ _{\rm simu} $
of the GM
$ (1, 1) $
, CFGM
$ (1, 1) $
, NGBM
$ (1, 1) $
, CFNGBM
$ (1, 1) $
and CFNGBM
$ (1, 1, \lambda) $
models in all cities
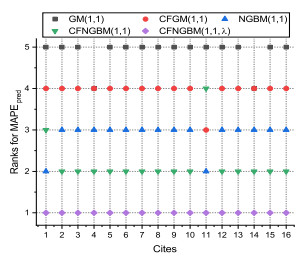
Figure 10
Summary of ranks for MAPE
$ _{\rm pred} $
of the GM
$ (1, 1) $
, CFGM
$ (1, 1) $
, NGBM
$ (1, 1) $
, CFNGBM
$ (1, 1) $
and CFNGBM
$ (1, 1, \lambda) $
models in all cities
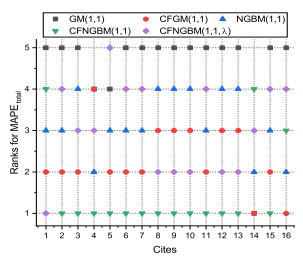
Figure 11
Summary of ranks for MAPE
$ _{\rm total} $
of the GM
$ (1, 1) $
, CFGM
$ (1, 1) $
, NGBM
$ (1, 1) $
, CFNGBM
$ (1, 1) $
and CFNGBM
$ (1, 1, \lambda) $
models in all cities
Table 24
The gross regional product of all cities in Cheng-Yu area by the CFNGBM
$(1, 1, \lambda)$
model in the next several years
Table 25
The annual increase rate of the gross regional product in the next several years (%)